Monitoring of Development of Certified Reference Material of Biodiesel by High Field NMR Spectroscopic Techniques
Amarjit S Sarpal*, Paulo R M. Silva, Thays V Monteiro, Mauricio Fonseca, Valnei S Cunha and Romeu J Daroda
DOI10.21767/2472-1948.100013
Amarjit S. Sarpal*, Paulo R. M. Silva, Thays V. Monteiro, Mauricio Fonseca, Valnei S. Cunha and Romeu J. Daroda
INMETRO-Institute National Metrology, Quality and Technology-Scientific Metrology Board and Industrial, Chemical Metrology Division, Rio de Janeiro, Brazil
- Corresponding Author:
- Amarjit S. Sarpal
INMETRO-Institute National Metrology, Quality and Technology-Scientific Metrology Board and Industrial
Chemical Metrology Division, Rio de Janeiro, Brazil.
Tel: 0919899443336
E-mail: sarpal.as2@gmail.com
Received Date: May 26, 2016; Accepted Date: June 06, 2016; Published Date: June 23, 2016
Citation: Sarpal AS, Silva PRM, Monteiro TV, et al. Monitoring of Development of Certified Reference Material of Biodiesel by High Field NMR Spectroscopic Techniques. J Sci Ind Metrol. 2016, 1:3.
Abstract
Analytical strategies based on Nuclear Magnetic Resonance (NMR) (500 MHz and 800 MHz) spectroscopic techniques (1H, 13C, 13C-DEPT) have been presented for monitoring the development of Certified Reference Material (CRM) of biodiesel meeting ASTM D 6751/EN 14214 specifications. The protocol includes the analyses of feedstocks of oil and biodiesel, and impurities generated during transesterification reaction by NMR methods duly validated by standard methods based on GC-MS. The quality parameters such as contents of ester (B100), linolenic acid (C18:3), poly unsaturated fatty acids (PUFA), residual acyl glycerides (mono, di, tri), free glycerin and fatty acid profile, and iodine values have been determined directly by newly developed methods based on NMR techniques in samples of biodiesel produced by transesterification reaction of soybean, sunflower, cotton, canola and corn (maize) oils drawn at different interval of times. The systematic 1H and 13C NMR spectral interpretation has revealed the presence of five types of residual glycerides (AGs) namely 1 or 2 mono glycerides (1-MG, 2-MG); 1,2 and 1,3 di glycerides (1,2-DG; 1,3-DG) and tri glyceride (1,2,3-TG) in the biodiesel as well as transesterified products independent of types and nature of vegetable oils. The spectral analyses of samples at 800 MHz NMR instrument has provided enhanced sensitivity and resolution of signals of interest, which enabled identification of very low levels of various AGs. The repeatability of standard Deviation (%SD) of quality parameters show that the NMR methods provide results with acceptable precision. The accurate and rapid profiling of residual impurities generated during transesterification reaction without any further chemical treatment will be an effective guide for the catalyst developer for the syntheses of novel catalysts required for quality control of biodiesel. A rapid and convenient approach has been described for the analyses and quantification of bound and free glycerin in the biodiesel and transesterified products, which will enable rapid quality assessment and certification of CRMs.
Keywords
Certified Reference Material (CRM); Biodiesel; Transestrification of vegetable oils; 1H and 13C NMR; GC-MS
Introduction
Quality control and assessment of biodiesel (B100) production are related to determination of 22 parameters of physical and chemical characteristics such as total ester content, free fatty acid value, glycerides (mono, di, tri), free glycerin and total glycerin contents, iodine value, calorific value, cetane number, flash point, ash content, refractive index, viscosity, density, fatty acid profile, linolenic ester content (C18:3), PUFA content etc. as specified in the standards ASTM D6751 and EN14214 (European Committee for Standardization (CEN) [1-10]. These standards define product specifications and measurement methods for biodiesel to be used as automotive and aviation fuels. The contaminants, which are introduced on account of bi products of transesterification reaction, such as bound glycerin (mono, di and tri glycerides), free glycerin and free fatty acids can lead to severe operational and environmental problems. Additionally, corrosion potential and inorganic contaminants (Na, K, Ca, P), which are indicated by PH and electrolytic conductivity, are the major concern of the fuel engine developer [11-15]. The legal demands for transport and trade of biofuels require very precise measurements of physical properties for quality control of the final product. There is an increasing demand to accurately measure the quality of biofuel products, particularly in view of the European directives promoting renewable energies (Directive 2009/28/EC), and setting out fuel quality requirements (Directive 2009/30/EC). Therefore, the quality control of biodiesel is of utmost significance to the success of its commercialization and market acceptance.
CRMs materials are certified under ISO Guide 34/35 accreditation, using primary methods of analyses that are validated by comparison with other worldwide NMIs, such as NIST in the USA. These materials consist of pure organic compounds to be used for calibration as well as wide range of complex matrix materials for validation or development of analytical techniques and methods for numerous products [9]. Certified reference materials are needed to give laboratories the possibility to demonstrate their method proficiency, proper working of their instruments, and check the performance and validation of their own developed or standard analytical methods [1-10].
The most commonly oils used for production of biodiesel are canola, soybean, sunflower, corn, cotton and palm, and their blends. Rapeseed based biodiesel is the most frequently used biodiesel in Europe. IRMM’s CRMs for FAMEs patterns are BCR- 162R (soya-maize oil blend), BCR-163 (beef-pork fat blend, SIGMA ALDRICH), ERM-EF001 (rapeseed) and soya and corn (Brazil, USA) based types of biodiesel used as standards for quality control of transport fuels. Gas-Liquid Chromatography (GLC) methods such as AOAC Fat in foods 966.06 (2005), AOCS Official Methods Ce 1h-05 (2005), Ce 1j-07 (2007), applied for analyzing the FAMEs in blends of different oils such as sunflower-soya, require CRMs for standardization of methods as well purity assay determination of such blends. For measurements of fatty acid profile for nutritional labeling and quality control of edible oils, GLC-463 Reference Standard containing 52 FAMEs mixture of short chain to long chain FAs, saturated (SFAs), monounsaturated (MUFAs), polyunsaturated (PUFAs), long chain-PUFAs (LC-PUFAs), and positional and geometrical FA isomers are used [16]. The provision of these materials as CRMs in the field of biodiesel analysis will support the creation of a harmonized measurement system and will increase the comparability of measurement results between laboratories, thus improving trust in the regulatory compliance of products on the market. CRMs address most of the issues related to Metrology such as confidence in measurements, wide acceptance of the results, and basis for standards and regulations. The CRMs are the convenient and effective guides to the overall process of production, quality assurance and transportation of biodiesel besides supporting norms of standardization and technical regulations, and conformity assessment and study the effects on engines environment, health, regulation and standardization and R&D activities [7-11].
Monitoring of new innovative processes for the development of biodiesel that requires in-depth knowledge of catalysts technology for the efficient, cost effective and eco-friendly products are aided by CRMs. Metrology of biodiesel has gained significance in terms of exploration of new generation renewable eco friendly energy resources of non edible oils and oleaginous yeast and algae biomasses to compensate for shortage of oil and high fuel prices [17-21]. CRMs have been recognized as authentic tools for fingerprinting of chemical composition required for export/import controls, tracing the biodiesel feedstock and tracing the geographical origin [5-7,22,23]. To assure long-term reliability and global comparability of analytical data, complete knowledge of the traceability chain to the International system of Units (SI) for measurement results of biofuel analyses is required. EU Policy (Thomsen Report of September 2007-binding, 2008) targeted for 2020 has recommended 20-30% GHG reduction, 20% energy efficiency improvement and 20% renewable energy including 10% biofuels. This is likely to be met by the production and introduction of biofuels meeting quality standards, which have been perceived by the metrology of biodiesel.
ISO Guide 34/35 dictates the guidelines for in depth study of concepts and processes for the production of CRMs. It underlines the steps such as sampling, production, planning, analyses, attributes of property value and uncertainty, declaration of metrological traceability and provision of information to the user of CRMs. The analytical strategies involve sampling, processing, conservation, analytes identification and quantitative analyses, and evaluation assessment. For these studies cailbrants are required for calibration in order to metrologically valid establishment of property values. Deep knowledge of measurement science is required to support regulations and standardization needs, as well as new production processes. The project EUROMET-ENG09 JRP BIOFUELS has provided validated reference measurement methods for the measurement of physical and chemical properties such as methanol content, glycerol content, glycerides content, selected FAMEs content, calorific value, density, viscosity, conductivity etc. that will help ensure the presence of biofuels in EU energy supply. Biodiesel fuel must conform to ASTM D 6751/EN14214 specifications for use in diesel engines. Testing for this confirmation is outlined in ASTM D6584 and similar method DIN EN 14105 (residual glycerides), EN14111 (iodine value), EN14103 (ester and C18:3 contents) and EN14110 (methanol content). These methods are based on determination by Gas Chromatography and potentiometry techniques. The feedstocks used for transesterification reaction are regular oil crops such as corn, soya, rapeseed, cotton, sunflower etc. These can be distinguished from their characteristic fatty acid profile, particularly distribution of unsaturated fatty acids (C18:N=0-3).
Host of Molecular and Atomic spectroscopic, and Chromatographic techniques are being used extensively for studying the composition and monitoring the quality aspects of oil, fat and biodiesel including algal oil [17-21,24-28]. FTIR and FT Raman techniques in combination with chemo metric analyses have been applied to resolve the quality issues of blended biodiesel, particularly adulteration with vegetable oils [29-34]. The issues related to quality control of diesel/biodiesel in Brazil as recommended by the ANP (the Brazilian National Agency for Petroleum, Natural Gas and Biofuels) are addressed by ASTM methods (ASTM 4052, ASTM D 445, ASTM D 4737, ASTM D 93, and ASTM D 86). These standards provide methodologies for the measurement of certain physical properties of biodiesel. It has been shown that these standards were not suitable to prevent the adulteration of B2 or B5 blends with vegetable oils. In order to resolve the problems of adulteration in Brazil, vibrational spectroscopic techniques (Fourier transform near infrared and Raman) are used to identify adulterations of B2 and B5 blends with vegetable oils. Partial least square regression (PLS), principal component regression (PCR), and artificial neural network (ANN) calibration models were designed and their relative performances were evaluated by external validation using the F-test [30]. High Performance Liquid Chromatography (HPLC) and Thin Layer Chromatographic (TLC) techniques are mainly used for monitoring the transesterification reactions for mono, di and triglyceridrs, free glycerin and classes of methyl esters [35-39]. The limit of detection of impurities by HPLC has been improved by the employment of detector of evaporative light scattering detection (ELSD) and atmospheric pressure chemical ionization mass spectrometry (APCI-MS) in positive ion mode [38]. GC, MS and GC-MS techniques usually find application in the determination of their fatty acid profiles and regiospecific distribution of fatty acids. Fatty acid methyl esters (FAMEs) have been quantified in various biodiesels and monitoring of transesterification reaction by using several methods, including MS, GC-MS and LC-ELSD, HPTLC-EASI-MS and GC-FID [17-21,40-46].
NMR techniques are inherited with unique capabilities of direct and non destructive types of analyses without the use of standards in multi-components system of fat, algal oils, and biodiesel obtained from different sources such as edible oil, non edible oil, algae and yeast oils. Nuclear Magnetic Resonance techniques (NMR) are extensively used in the oil and fat industry to monitor the transesterification process and quality of biodiesel. More important is the diverse analytical capabilities of multinuclear ID and 2D NMR (1H/13C/31P) to provide detailed quantitative compositional analyses such as lipid content, PUFA content, fatty acid profile, iodine value, production and quality monitoring of oil and biodiesel from different sources [17-21]. Methods based on NMR are quantitative, direct and rapid; require no standards and pre chemical treatment compared to other methods. Due to multinuclear capability (1H,13C,15N, 31P) and use of 2D NMR and spectral editing analyses, NMR techniques have proved rapid and reliable aid to the bio refinery for quality control of biodiesel [17-21,47-56]. The technical tools and processes for monitoring the transesterification reactions like TLC, GC, HPLC, GPC, 1H NMR and NIR have been reviewed by Tyagi et al. [1] and Mehar et al. [1,11]. Catalysts used for the transesterification of triglycerides are classified as alkali, acid, enzyme or heterogeneous catalysts, among which alkali catalysts like sodium hydroxide, sodium methoxide, potassium hydroxide and potassium methoxide are more effective [11]. Methods based on 1H NMR techniques have been recognized as effective, rapid and convenient tools for monitoring the progress of transesterification reactions, particularly quantitative determination of the residual impurities of mono, di and tri glycerides [17,29,51,57-60].
In the present studies a systematic analytical protocol involving NMR techniques and methods has been established for complete chemical characterization including monitoring of transesterification reaction of oils and biodiesel materials selected for the development and standardization of CRMs of biodiesel (B100). This is also in order to meet objectives mentioned in white paper on internationally compatible biofuel standards tripartite task force Brazil, European Union and United States of America December 31, 2007. The emphasis is given to some of the selected parameters specified in the European Committee for Standardization in 2012 in standard EN 14214 such as ester content (96.5% w/w), PUFA (≥ 4, 1% w/w), linolenic acid (C18:3, 12% w/w), free glycerin (0.02%/w/w), total free and bound glycerin (0.25% w/w), fatty acid profile and iodine value (120 g I2/100 g).
Material and Methods
Oil and biodiesel samples
The samples of oils of soya, corn, sunflower, canola and cotton were procured and transesterified using the solid catalyst under optimized parameters of temperature and reaction time. The biodiesel samples (transesterified products) were taken at different interval of time (1 min, 2 min, 3 min, 5 min etc.) for analyses by NMR and GC-MS techniques. The samples drawn at different interval of times were allowed to stand overnight for settling of glycerin and water.
Feedstock for CRM of soya based biodiesel
The feed stock, designated as INM1, for the preparation of soya based CRM was procured from commercial source. The candidate CRM was prepared as per the guidelines mentioned in ISO Guide 34/35. The methodology and objectives are described in the references 2, 3 and 9. The samples of CRM were packed in different ampoules designated as INMETRO-1309, INMETRO-2837 etc.
Instrumental analyses
NMR recordings
The 1H NMR spectra were recorded on a Bruker 500 MHz NMR spectrometer (11.7434 T) equipped with broad band probe (BB) and inverse probe (BBI), and 800 MHz spectrometer (18.8 T) equipped with triple quantum (TQ) dual probe (1H/13C). The solutions were prepared by dissolving 10 mg and 5 mg of vegetable oils and biodiesels, and samples drawn at different interval of time in 0.7-0.8mL of CDCl3 containing internal reference TMS, respectively for recording on a 500 MHz and 800 MHz instruments. Instrument parameters such as relaxation delay (D1) and receiver gain (RG) were optimized and 90O PW calibrated in order to sufficiently relax the nuclei to get the quantitative spectra as described in our previous work [17,20,50]. The 90O pulse width (PW) was calibrated for each sample. The variation in the PW was observed in the range of 8.1-8.64 μs for 500 MHz instrument depending upon the concentration of the sample. Following parameters were used for each recording spectra at 500 MHz and 800 MHz instruments:
Relaxation delay (D1)=10s; P1 (90O PW)=8.13-8.64 μs (500MHz); NS (number of scans)=16 or 32, Chemical shift range: 0-12 ppm.
All the spectra were integrated thrice after proper phase and base line corrections, and average integrated intensities (II) were taken for quantitative analyses. The 13C NMR spectra of solutions of oils and biodiesels in CDCl3 (25% v/v) were recorded at 125.72 MHz on a Bruker 500 MHz NMR Spectrometer using BBI probe. The overnight recordings (~5000 to 10,000 scans) with a relaxation delay time of 10 or 15 s in inverse gated mode, PW of 15 μs and sweep width of 0-240 ppm were carried out. The 13C-DEPT 135 NMR spectra (~5000 scans, D1=3s) were recorded on a 500 MHz NMR spectrometer as per the pulse sequence, acquisition parameters and instruction mentioned in the references [62-63].
The multipoint base line correction was applied for integration of region 3.8-4.4.0 ppm due to residual mon, di and tri glycerides. The region 3.8-5.28 ppm was expanded both horizontally and vertically in order to observe clearly the signals due to mon, di and triglycerides, and multistep base line corrections applied. This has facilitated the perfect base line and phase correction for accurate measurement of integral intensities of very low level of (0.04-0.15%) components corresponding to residual glycerides.
GC-MS analyses
FAMEs produced directly from the oils were analyzed by GC-MS by the method EN14103 using C19 FAME as internal standard, carried on a Shimadzu Gas chromatograph equipped with Quadruple Mass spectrometer using electron impact ionization. A capillary polar PEG wax column (30m length, diameter 0.25mm, film thickness 0.25 μm) was used for separation of FAMEs. The temperatures of injector and column were maintained at 265°C and 250°C, respectively. Heptanes solutions (3-5 mg/1ml) were injected in split ratio of 150:1 applying the ramp: 70°C for three minutes, 10°C per minute from 70-240°C, hold time 13 minutes and finally 50°C per minute up to 250°C and held it for 10 minutes. The identification of all types of saturated and unsaturated components including DHA and EPA was carried by comparing with the profile of NIST 2772, PUFA standard, and FAMEs of fish oil. Quantification of ester content and each fatty acid was based on comparison with the retention times of standards and internal standard C19 FAME.
Determination of iodine values (IV)
The IVs of samples of oils, biodiesel and transesterified products were determined by following the procedure given in the standard EN14111. Before every determination, samples were homogenized by gentle warming on a water bath (50°C). Solutions were standardized as per the procedure given in reference [50].
Results and Discussion
Analytical strategies and protocol for quality assurance steps for development of CRM of biodiesel
The analytical strategies involve the analyses of feed stocks (oil or biodiesel) and transesterified products of biodiesel for determination of ester content, fatty acid composition etc. by the application of NMR (1H, 13CNMR, 13C-DEPT) and GC-MS techniques as discussed in the succeeding sections (Figure 1).

Figure 1: Chemical structures of mon, di and tri glycerides marked with sn1, sn2 and sn3 steriospecific acyl carbons
GC-MS analyses
GC-MS analyses of biodiesel and transesterified products of different oils, and CRM NIST 2772 for ester content, fatty acid distribution and C18:3 content determined by the method EN14103 are given in the Table 1. The PUFA content represent the C18:3 content as mentioned in Table 1.
| S.No | Sample | C16 | C16:1 | C18:0 | C18:1 | C18:1* | C18:2 | C18:3 | C20:0 | C20:1 | Ester |
|---|---|---|---|---|---|---|---|---|---|---|---|
| 1 | Cotton 0 m | 23.84 | 0.39 | 2.15 | 14.30 | 0.63 | 58.7 | nd | nd | nd | 99.7 |
| 2 | Cotton 1 m | 22.75 | 0.41 | 2.47 | 15.61 | 0.69 | 57.44 | nd | nd | nd | 72.4 |
| 3 | Cotton 10 m | 22.90 | 0.43 | 2.57 | 16.07 | 0.82 | 56.68 | nd | nd | nd | 86.7 |
| 4 | Cotton 15 m | 22.93 | 0.42 | 2.51 | 15.88 | 0.76 | 56.46 | nd | nd | nd | 89.6 |
| 5 | Canola 0 m | 4.93 | 0.20 | 2.00 | 62.43 | 2.78 | 18.82 | 7.0 | 0.66 | 1.18 | 98.8 |
| 6 | Canola 1 m | 5.06 | nd | 2.95 | 59.4 | 3.31 | 19.92 | 7.1 | 0.86 | 1.20 | 71.3 |
| 7 | Canola 3 m | 5.07 | nd | 2.94 | 59.47 | 3.20 | 20.15 | 7.14 | 0.82 | 1.14 | 86.4 |
| 8 | Canola 10 m | 5.02 | nd | 2.96 | 59.51 | 3.15 | 20.12 | 7.08 | 0.88 | 1.16 | 90.6 |
| 9 | Canola 15 m | 5.05 | nd | 2.99 | 59.36 | 3.22 | 20.18 | 7.21 | 0.87 | 1.14 | 89.6 |
| 10 | Corn 0 m | 11.83 | 0.12 | 2.65 | 34.71 | 0.71 | 48.0 | nd | nd | nd | 98.3 |
| 11 | Corn 3 m | 11.90 | 0.11 | 2.3 | 34.3 | 0.70 | 48.18 | 1.38 | 0.59 | 0.31 | 91.4 |
| 12 | Corn 10 m | 13.95 | 0.15 | 2.7 | 34.76 | 0.72 | 48.09 | 1.30 | 0.64 | 0.36 | 88.5 |
| 13 | Corn 15 m | 11.96 | 0.10 | 2.52 | 34.36 | 0.72 | 48.11 | 1.29 | 0.58 | 0.27 | 91.9 |
| 14 | SFL 0 m | 6.72 | nd | 4.14 | 23.67 | 0.63 | 66.41 | 0.32 | 0.29 | 0.65 | 99.8 |
| 15 | SFL 1 m | 6.71 | nd | 4.17 | 23.65 | 0.63 | 64.36 | 0.31 | 0.30 | 0.62 | 64.8 |
| 16 | SFL 3 m | 6.61 | nd | 4.28 | 23.52 | 0.71 | 64.40 | 0.35 | 0.29 | 0.65 | 79.7 |
| 17 | SFL 10 m | 6.65 | nd | 4.28 | 23.76 | 0.71 | 64.41 | 0.30 | 0.32 | 0.63 | 85.6 |
| 18 | SFL 15 m | 6.67 | nd | 4.19 | 23.41 | 0.64 | 63.82 | 0.32 | 0.32 | 0.65 | 85.7 |
| 19 | NIST 2772b | 10.0 | nd | 3.85 | 22.63 | 1.14 | 55.2 | 7.2 | nd | nd | 99.4 |
| 20 | 1NM1 | 11.8 | 0.21 | 3.92 | 25.92 | 1.16 | 53.23 | 5.52 | nd | nd | 97.8 |
| 21 | Soybean O1 | 11.9 | nd | 4.02 | 21.16 | 1.41 | 54.14 | 7.39 | nd | nd | - |
| 22 | Soybean O2 | 11.9 | nd | 3.8 | 25.3 | 1.3 | 52.5 | 5.2 | nd | nd | 97.2 |
| 23 | INM 1309 | 12.5 | 0.18 | 3.98 | 25.8 | 1.42 | 53 | 4.99 | nd | nd | 96.8 |
| 24 | INM 2199 | 12.1 | 0.16 | 3.96 | 26.4 | 1.36 | 53.8 | 5.03 | nd | nd | 97.0 |
| 25 | INM 2836 | 11.4 | 0.16 | 3.97 | 26.5 | 1.29 | 53.6 | 4.96 | nd | nd | 99.7 |
| 26 | INM 1019 | 12.7 | 0.18 | 4.03 | 26.1 | 1.46 | 53.7 | 5.06 | nd | nd | 95.2 |
| 27 | INM 2904 | 12.1 | 0.2 | 4.02 | 26.4 | 1.33 | 53.8 | 4.99 | nd | nd | 97.3 |
Traces of C17:0 present in Corn samples, 0 m (0 minute), 1 m (1minute), 3 m (3 minutes) etc. are transesterification reaction times, nd=Not detectable, SFL=Sunflower, Cotton samples are also containing C14:0 =0.65 % w/w. *10-oleic acid, b-batch b
Table 1: Fatty acid composition and ester content (% w/w) of trancesterified products of vegetable oils at different interval of reaction by GC-MS (EN14103).
1H NMR spectral features of samples of vegetable oils and biodiesel
The 1H NMR spectra of soya oil, soya biodiesl and their blend are shown in Figures 2-4. The spectrum of soya oil clearly indicate signals at 4.05-4.38 ppm (OCH2; sn1, sn3), 5.25 ppm (OCH; sn2) due to glycerol moiety, 5.05-5.5 ppm (CH=CH), 2.6-2.9 ppm (bisallylic, CH=CH-CH2-CH=CH), 2.1-2.5 ppm (CH2C=O), 1.9-2.1 ppm (allylic,CH2-CH=CH-), 1.61 ppm (CH2-CH2C=O); 1.24 ppm & 1.30 ppm (long alkyl chain (CH2)n) and 0.75-1.0 ppm due to terminal CH3 characteristics of triglycerides comprising of both saturated (C14-C18) and unsaturated (C18:N=1-3) fatty acid chain. These signals are properly marked in the region of their characteristic signals in Figure 2. The presence of PUFAs containing n-3 ω types of three double bonds is confirmed by the appearance of a triplet due to terminal CH3 at 0.98 ppm, which is clearly separated from the signals of terminal CH3 of saturated (C18:0, C16:0, C14 etc.) or n-6/n-9 types of unsaturated components (C18:1, C18:2) at 0.88 ppm. The characteristic signals due to different unsaturated fatty esters in the region of 2.6-3.0 ppm such as C18:2 (2.77 ppm) and C18:3 (2.81 ppm) are well marked in the expanded part of region of 2.6-3.0 ppm as shown in the Figure 4. The signals due to hydrogens of unsaturated groups, -CH=CH-, of all unsaturated fatty acids, C18:N=1-3, are merged and appeared as multiplet in the region of 5.05-5.55 ppm, partly overlapped with the signals of proton of sn-2 OCH groups. It is not possible to observe the signals of terminal methyl, allylic CH2s and -CH=CH- functional groups of C18:1 as these signals are merged along with the corresponding signals of C18:2 and saturated fatty acids in the regions of 0.88, 2.0 and 5.05-5.65 ppm respectively. However, the presence of C18:1 can be confirmed directly in the spectra recorded at higher field 800 MHz instrument discussed in the succeeding sections.

Figure 2: 500 MHz 1H NMR spectrum of soybean oil marked with different functional groups in their characteristic chemical shift regions.
The spectral features of canola oil are identical to those observed for soya oil except in the relative variation of intensities of signals corresponding to C18: N=1-3 as shown in the Figures 4 and 5. The spectral features of cotton, jatropha and sunflower oils are also identical in nature to those appeared in cases of soya and canola oils except the absence of terminal CH3 signal of PUFA (C18:3) (signal 2 and 9, Figure 5). The variation in intensities of signals due to bisallylic groups (CH=CH-CH2-CH=CH) of C18:2 and C18:3 observed at 2.77 and 2.81 ppm respectively in the spectra of different oils indicate their relative amount present in their respective oils. It is in accordance to the results of unsaturated fatty acid composition determined by GC-MS as mentioned in the Table 1. Thus IH NMR spectral features can be used to make distinctions among different types of oils as shown in Figure 5.

Figure 4: 500 MHz 1H NMR expanded view of part spectra of soybean oil and biodiesel, and their blends marked with different functional groups in their characteristic chemical shift regions. Peak assignments: 5=allylic CH2 of C18:2 and C18:3, 5’=allylic CH2 of C18:1, 6=CH2C=O, 7=bisallylic CH2 of C18:2, 8=bisallylic CH2 of C18:3.

Figure 5: 1H NMR spectra of different oils. Peak assignments: 1=Terminal CH3 of n-6, n-9 ω fatty acids, 2=terminal CH3 of n-3 ω fatty acids (C18:3), 3=(CH2)n, sharp peak at 1.52 ppm= signal of water present in CDCl3, 4=β, 6=allylic CH2 of C18:2 and C18:3, 5=allylic CH2 of C18:1, 7=CH2C=O, 8=bisallylic CH2 of C18:2, 9=bisallylic CH2 of C18:3; 10,11=OCH2 ester group of sn-1 and sn-3 positions, 12=OCH eater group of sn-2 position, 13=CH=CH and *=standard sample.
As shown in the (Figure 3), the spectral features of soya biodiesel are identical to those observed for soya oil in the region of 0.5- 3.0 ppm, which are due to signals of long alkyl fatty acid chain. The major differences were observed in the region of 3.5-5.5 ppm, which contain resonances due to ester and unsaturated hydrogens. After transesterification, the signals at 4.05 to 4.38 ppm (OCH2; sn1, sn3) and 5.26 ppm (OCH; sn2) due to glycerol moiety of oil were found to disappear, and ester signal OCH3, characteristic of biodiesel, appeared at 3.67 ppm. No change in the chemical shift values of ester signal at 3.67 ppm and signals due to long fatty acid chain were observed in the 1H NMR spectra of biodiesels of different oils as reported by Sarpal et al. on elaborate studies of biodiesel samples prepared from different oils [50]. It is also convenient and simple to identify directly biodiesel and oils when present in their blends as shown in the spectrum of bend of soya oil and soya biodiesel (Figure 3) [50, 55].

Figure 3: 500 MHz 1H NMR spectra of soybean oil and biodiesel, and their blends marked with different functional groups in their characteristic chemical shift regions. Peak assignments: 1=Terminal CH3 of n-6, n-9 ω fatty acids, 2=terminal CH3 of n-3 ω fatty acids (C18:3), 3=(CH2)n,*=signal of water present in CDCl3, 4=β CH2, 5=allylic CH2 of C18:2 and C18:3, 5’=allylic CH2 of C18:1, 6=CH2C=O, 7=bisallylic CH2 of C18:2, 8=bisallylic CH2 of C18:3, 9=OCH3 ester group of biodiesel; 10,11=OCH2 ester group of sn-1 and sn-3 positions, 12=OCH eater group of sn-2 position, 13=CH=CH.
From the above detailed spectral interpretation, it is evident that spectral features are characteristics for each type of oils and biodiesels and, therefore, can be used for differentiation of oils and biodiesels obtained from different sources. Multivariate Statistical methods in combination with 1H NMR spectral analysis such as Principal Component Analysis (PCA), Pattern Recognition etc. have been reported for differentiation, source identification and adulteration of biodiesel [57].
13C NMR Spectral features of oil and biodiesel
The 13C NMR spectra of vegetable oils and their corresponding biodiesels offer several advantages relative to 1H NMR spectra due to larger chemical shift range of 20 times higher, which display well resolved, distinct and sharp signals. This enables to determine oil profiling and their fatty acid composition more precisely, provided quantitative spectra are recoded [17,20,50]. The presence of C18:1, C18:2, C18:3 and higher fatty acids such as C20:5 (EPA) and C22:6 (DHA) are directly observed and quantified. The 13C NMR spectra of sunflower, corn and soya oils, and soya biodiesel as shown in the Figure 6 and expanded views of different chemical shift regions shown in Figure 7, demonstrate well resolved and sharp signals characteristic of triglycerides and their corresponding fatty acid chain. The spectra display carbonyl groups of saturated and unsaturated fatty esters at 173.28 and 173.24 ppm (OCH2, sn1, 3), and 172.83 ppm (OCH, sn2), unsaturated carbons (CH=CH) of C18:N (N=1-3) and higher carbon numbers between 126-132 ppm; OCH2 (sn1, 3) and OCH (sn2) of triglycerides (TG) at 62.05 and 68.87 ppm; CH2C=O at 33.8- 34.0 ppm, and long alkyl saturated and unsaturated fatty chain at 31.93 ppm (ɤ- CH2), 22.7 ppm (β-CH2), 14.1-14.3 ppm (α-CH3), 29-30 ppm (CH2)n and 23-27 ppm (CH2S) (Figure 7). The signals due to unsaturated fatty acids, C18:N=1-3, are clearly visible without overlapping, thus enable their quantification directly [17,20,21]. The signals corresponding to esters and unsaturated fatty acid chain are marked in the Figures 6 and 7, and also explained in the legends of Figures. The biodiesel is identified by its characteristic ester signals at 174.22 ppm (C=O) and 174.18 ppm (C=O) for saturated and unsaturated esters respectively, and 51.37 ppm (OCH3). The nature and identities of signals due to long fatty acid esters alkyl chain are similar to those appeared in oils (Figures 6 and 7). Thus, it is possible to distinguish oil and biodiesel when both are present in a blend [17-20].

Figure 6: 125.72 MHz 13C NMR spectra of different oils and biodiesel marked with functional groups in their characteristic chemical shift regions.

Figure 7: 127.72 MHz 13C NMR expanded view of spectra of different chemical shift regions of different oils and a biodiesel. Peak assignments: 1,1’,4=n-3 ω C18:3; 2,2’, 6=C18:2; 3,3’=C18:1; 5=C18:1:C:S; 7= C=O(ester) of biodiesel.
800 MHz 1H NMR analyses
The principal drawbacks of NMR instruments are low sensitivity and resolution compared to FTIR or GC-MS instruments, which hinder the direct quantitative analyses of components in case of overlapped or poorly resolved signals obtained in the 1H or 13C NMR spectra. The recent development of cryo-probes and micro coil technology, combined with high fields instruments (600-800 MHz), has improved drastically detection limits and resolution, making it possible to analyze increasingly smaller quantities, with increasing reliability [62].This was demonstrated for 1H NMR analyses of a biodiesel CRM NIST2772, carried out on 500 and 800 MHz NMR spectrometers as shown in the (Figures 8a and 8b). The spectra recorded on 800 MHz instrument has provided spectral features with enhanced resolution and sensitivity of signals due to different functional groups corresponding to unsaturated fatty acids C18:1 (signal 5; 2.0 ppm), C18:2 (signal 7, 2.77 ppm) and C18:3 (signals 2, 8; 0.98 ppm, 2.81 ppm) compared to those recorded on a 500 MHz instrument shown in the same Figure. The sample amount was taken 10 mg and 5 mg / 0.7 ml CDCl3 for 500 and 800 MHz instruments respectively, and spectra were recorded under identical acquisition parameters. The width of the signals at 800 MHz is smaller compared to 500 MHz spectrum as shown in the Figure 8. The improvement in the resolution of the signals in the spectrum of a sample recoded at 800 MHz will enable to quantify directly the content of C18: N=1- 3 without the use of complex mathematical equations, which is generally done in the case of 500 MHz or lower field instruments [47,52,55,60,63].

Figure 8a: 500 and 800 MHz 1H NMR spectra of CRM NIST 2772. Peak assignments: 1=Terminal CH3 of n-6, n-9 ω fatty acids, 2=terminal CH3 of n-3 ω fatty acids (C18:3), 3=(CH2)n,*=water signal, 4=β CH2, 5=allylic CH2s of C18:2 and C18:3, 5’=allylic CH2 of oleic acid, 6=CH2C=O, 7=bisallylic CH2 of C18:2, 8=bisallylic CH2 of C18:3, 9=OCH3 ester group; 10,11=region of ester group of glycerides, 13=CH=CH.

Figure 8b: 500 and 800 MHz 1H NMR expanded view of part spectra of CRM NIST 2772. Assignments of peaks are same as given in the Figure 8a.
The spectrum of canola oil recoded at 800 MHz also depicted enhanced resolution of all the signals, particularly of signals of interest due to C18:1(signal 5, 2.0 ppm), C18:2 (signal 8, 2.77ppm) and C18:3 (signals 2, 9; 0.98 ppm, 2.81 ppm) compared to those recorded at 500 MHz (Figure 9). It was interesting to note that the peak width of ester signals due to sn1, sn3 (4.05-4.38 ppm, OCH2) and sn2 (5.26 ppm, OCH) configurations had been found to decrease at 800 MHz instrument. This has also resulted in decrease of coupling constant at 800 MHz compared to those recoded at 500 MHz. Both these factors will enable to determine integral intensities more precisely for accurate determination of ester content, iodine values and fatty acid profile directly without resorting to use of complex equations usually encountered in case of analyses carried out at lower magnetic field [55,60].

Figure 9: 500 and 800 MHz 1H NMR expanded view of part spectra of different chemical shift regions of canola oil. Assignments of peak numbers to various functional groups are the same as given in the Figure 4.
Monitoring of transestrifiction reaction of sunflower, corn, cotton and canola oils by 500 MHz and 800 MHz 1H NMR spectral analyses
Biodiesel is produced by transesterification reaction in which, oil or fat is reacted with a monohydric alcohol (CH3OH, CH2CH3OH) in the presence of a catalyst (alkali, acid, enzyme or heterogeneous) as discussed in details by Tyagi et al. [1] and Meher et al. [11]. Methods based on 1H NMR technique have been proved to be rapid, direct and convenient for monitoring the conversion of oil in to biodiesel, study of kinetic of reaction and determination of most of the quality parameters specified in the specification ASTM D6751 and EN14214. The biodiesel produced by transesterification reaction is contaminated by the residual impurities such as mono, di and triglycerides (bound glycerin), free glycerin, methanol and metals (Ca, K, P, etc.) [11,47,51,52,55,57,59,60]. Thus, post transesterification purification process is employed in order to meet the specification [61]. The sunflower, corn (maize), cotton and canola oils were transesterified for monitoring the reaction for quality parameters for the development of CRMs of biodiesel, and products analyzed in order to demonstrate the capabilities of ID NMR techniques (IH NMR, 13C NMR, DEPT 13C NMR). As shown in the Figure 10a, the 500 MHz 1H NMR spectra of transesterified products of sunflower oil at different intervals of times (1 to 15 minutes) indicate spectral features characteristic of a biodiesel on comparison with the spectral features of sunflower oil given in the Figure 5. The spectra indicate spectral features identical to those observed for parent oils with regards to signals corresponding to hydrogens of various functional groups of unsaturated (CH=CH, 5.05-5.65 ppm) and fatty acid chain comprising of both saturated (C16:0, C18:0) and unsaturated (C18:1, C18:2; 2.0, 2.77 ppm) fatty acid. The ester signals due to OCH2 and OCH groups of tri glycerides were found to disappear, and signal due to OCH3 ester group of biodiesel appeared at 3.67 ppm (marked G) as marked in the Figure 10a. The sharp signals of low intensities appeared at 3.49 ppm were assigned to hydrgens of free glycerin, and their identities were confirmed on comparison with the spectra of blends of biodiesel and free glycerin recoded under identical acquisition parameters. The variation in the intensities of signals due to hydrogens of glycerin observed at different interval of reaction times show their relative concentration in the respective products. The spectra show signals of very week intensities in the chemical shift region of 3.9-5.28 ppm due to hydrogens of glycerol back bone of mono, di and triglycerides (Figure 1). These signals were practically not observed at normal spectrum amplitude of recording. However, large number of signals marked 1 to 9 were observed in the vertical expanded part spectra in the chemical shift regions of 4.8-5.28 ppm and 3.5-4.4 ppm (Figure 10b). These signals comprising of multiplets were assigned to mono, di and triglycerides residual bi products generated on account of transesterification reaction (Figure 1). The transestrifiction of corn, cotton and canola oils has generated similar types of residual glycerides and free glycerin except the variation in their relative contents in the products as revealed by 1H NMR spectral profiling of products obtained at same intervals of reaction times (Figures 11 and 12). Figures for cotton products are not given. The assignments of signals in their respective chemical shift regions corresponding to different types of glycerides are compiled in the Table 2.
| TAG | 1-MG | 2-MG | 1,2-DG | 1,3-DG | 1,2,3-TG | GLY |
|---|---|---|---|---|---|---|
| 1HNMR Chemical Shift ppm | 3.91-3.97(1H) 4.11-4.21(2H) 3.60-3.71(2H) |
4.9(1H) 3.85(4H) |
4.26-4.35(1H) 4.20-4.26(1H) 3.7-3.8(2H) 5.0-5.12(1H) |
4.05-4.1(1H) 4.1-4.23(4H) |
4.1-4.24(2H) 4.27-4.34(2H) 5.23-5.28(1H) |
3.49 |
| Peak no. as marked in region of 3.8-5.28 ppm in (Figures 10-14) | 7,6 I1MG= I3.91-3.97 ppm |
9* | 8, 3,4,11 I12DG= I5.0-5.12 ppm |
6,5,6 I13DG =0.2[(I4.0-4.21 ppm)-2(I1MG)] |
1,2,13 ITG=0.5 [(I4.19-4.35 ppm)-2(I12DG)] |
G IG = I3.49 ppm |
| 13C- DEPT NMR Chemical Shift ppm | 63.35(CH2) 65.14(CH2) 73.22(CH) |
73.45 | 61.38(CH2) 72.08(CH) 62.23(CH2) |
65.06(CH2) 68.25(CH2) |
62.1(CH2) 68.9(CH) |
63.50(CH2 72.48(CH) |
| Peak no. (Figure 14) | 6, 7, 8 | absent | 1, 3, 2 | 11. 12 | 4, 5 | 9, 10 |
1-MG=sn-1 mono glyceride, 2-MG=sn-2 mono glyceride; 1,2-DG=sn-1, sn-2 di glyceride; 1,3-DG=sn-1, sn-3 diglyceride; 1,3,3-TG=Triglyceride, GLY=Free glycerin, I1MG, I12DG etc. are the % integrated intensities of one hydrogen (mole %) in their respective chemical shift regions, *in case of cotton and corn only
Table 2: 1HNMR and 13CNMR chemical shift regions of residual glycerides.

Figure 10a: 500 MHz 1H NMR spectra of transesterified products (biodiesel) of sunflower oil at different interval of reaction times. Peak assignments:1=Terminal CH3 of n-6, n-9 ω fatty acids, 2=absence of terminal CH3 of n-3 ω fatty acids (C18:3), 3=(CH2)n, *=water signal of CDCl3, 4=β CH2, 5=allylic CH2 of C18:2 and C18:3, 5’=allylic CH2 of C18:1, 6=CH2C=O, 7=bisallylic CH2 of C18:2, 9=OCH3 ester group, 13=CH=CH, G=free glycerin.

Figure 10b: 500 MHz 1H NMR expanded view of part spectra of transesterified products (biodiesel) of sunflower oil at different interval of reaction times (Min=minutes). Peak assignments to functional groups of mono, di and triglycerides are given in Table 2. Peaks 10 and 12 are unidentified.

Figure 11: 500MHz 1H NMR expanded view of part spectra of transesterified products of corn oil at different interval of reaction times. Peak assignments to mono, di and triglycerides are given in Table 2.

Figure 12: 500MHz 1H NMR expanded view of part spectra of transesterified products of canola oil at different interval of reaction times. Assignments to peak numbers to mono, di and triglycerides are given in Table 2.
It is quite evident from the above systematic 1H NMR spectral studies that similar types and nature of residual glycerides including free glycerin products are generated during transesterification irrespective of the nature of the vegetable oils. Further, only five types of residual glycerides namely 1-MG, 2- MG; 1, 2-DG; 1, 3-DG and 1, 2, 3-TG were formed on account of transesterification reaction carried out at different interval of times (Figures 10-12) (Table 2). The concentration of each biproduct in the transesterified product ie. biodiesel was found to be dependent on the nature of oils and gradually decreased with increase in the reaction time. The graphical representation of reaction path and formation of residual products are discussed in the succeeding section.
The 800 MHz 1H NMR spectra of transesterified products of cotton oil recorded at different interval of times as shown in the Figure 13 has shown enhancement in the resolution and sensitivities of signals due to residual glycerides compared to those recorded at 500 MHz shown in the same figure. The characteristics signals due to components 1,3-DG (peak 6’, 4.05-4.10 ppm and 1-MG (peak 7, 3.91-3.97 ppm) are resolved with narrow line width. The signals of low intensity due to 2-MG were found to appear at 4.9 ppm in few products only (not shown in the Figure).

Figure 13: 500 and 800 MHz 1H NMR expanded view of part spectra of different chemical shift regions of tranesterified products (biodiesel) of cotton oil. Assignments of peak numbers to various functional groups are given in Table2.
Confirmation of assignment of signals of residual glycerides in the 1H NMR spectra of transestrified products
Three approaches have been adopted for unambiguous assisgnment of signals appeared in the region of 3.5-5.28 ppm. Firstly, the assignment has been carried out by analyzing the spectra of blends of mono, di and tri glycerides prepared in different proportions as discussed previously [18]. Secondly, consulting the research work of Nieva-Echevarría et al. [51] and Anderson et al. [59], who have presented systematic description and demarcation of chemical shift regions corresponding to characteristic multiplets due to mono (1-MG, 2-MG), di (1,2- DG; 1,3-DG) and tri (1,2,3-TG) glycerides. Based on these experimental evidences, the multiplets observed in the reaction products of sunflower oil were assigned to 1-MG (1H, 3.91-3.97 ppm; 2H, 4.11-4.21 ppm; 2H, 3.6-3.71 ppm), 2-MG (1 H, 4. 9 ppm; 4H, 3.85 ppm), 1,3-DG (1H, 4.05-4.10; 4H, 4.11-4.23 ppm) and 1,2-DG ( 1H,4.26-4.35; 1H, 4.20-4.26 ppm; 2H, 3.7-3.8; 1H, 5.0-5.12 ppm) and TG (2H, 4.27-4.34 ppm; 2H, 4.1- 4.24 ppm; 1H, 5.23-5.28 ppm). The presence of 2-MG was indicted in the products of corn and cotton oils at very low level after 1minute interval, and completely disappeared as the reaction proceeded (Peak 9). The amount of these residual components was found to decrease gradually with the increase in the reaction time. The 1-MG (3.906-3.965 ppm; 2H, 4.11-4.21 ppm; 2H, 3.65-3.71 ppm) has been found to disappear completely after 15 minutes of reaction time.
The third approach adopted was DEPT (Distortionless Enhancement by Polarisation Transfer) 13C NMR analyses, which has provided authentic information about multiplicities of different carbons (CH, CH2, CH3 and quaternary C) in a 13C NMR spectrum of transesterified products. DEPT is a 1D experiment, but unlike decoupling and NOE, it involves a multiple pulse sequence. There are three types of DEPT experiments denoted as DEPT-45 (positive signals for all carbons), DEPT-90 (positive signals for all except quaternary C) and DEPT-135 (positive for CH, CH3; negative for CH2 and no signal for quaternary C or vice versa for better representation in case of complex spectra) [62]. The 13C-DEPT NMR spectra generate distinct and sharp signals well resolved without multiplets in contrast to 1H NMR spectra, thus make the task convenient of assignments. DEPT-135 has been used for positional isomerism i.e., 1,3 (sn1, 3) and 2 (sn2) distribution of fatty acids in tri glycerides [63]. As shown in the Figure 14, the DEPT-135 spectra of sunflower and cotton transesterified products (biodiesel) obtained at each one minute of reaction time clearly provide distinction among various carbons multiplicities (CH,CH2,CH3) corresponding to mono, di and triglycerides, and free glycerin components as marked in the spectra. The DEPT analyses have practically ruled out the presence of 2-MG (73.22 ppm), the same was also claimed by 1HNMR spectral analyses. The chemical shift values or ranges of each type of glycerides, and free glycerin are compiled in the Table 2)

Figure 14: 500 MHz 13C- DEPT NMR full (A) and expanded view of part spectra (B) of cotton and sunflower oils after 1minute of transesterification reaction. Assignment of peak numbers to mono, di and triglycerides are given in Table 2.
From the above 1H and 13C NMR spectral interpretation and assignment of chemical shift region of 3.9-5.28 ppm and 55-74 ppm to mono, di and tri glycerides present in the transesterified products of different oils (Figures 10-14), following interesting results were revealed:
No change in the chemical shift values of residual mono, di and tri glycerides in the transesterified products with the change in the nature of oils such as sunflower or canola or cotton or corn was observed. This showed that there was no change in the structure or chemical environment of different glycerides with the change in the nature of fatty acids constituting a particular oil.
There are only five types of acyl glycerides (AGs, namely 1-MG, 2-MG, 1, 2-DG, 1,3-DG and 1,2,3-TG generated during transesterification reaction of oils irrespective of the nature of oils used for reaction.
The residual product 2-MG has been found to present only in case of transesterified products of corn and cotton oils as confirmed by both 1H and 13CNMR analyses. The residual product 1, 3-DG has been generated in higher amount compared to other acyl glycerides in all the transesterified products of different oils. This might be due to regiospecific preference received during hydrolyses and transesterification of tri glycerides. Similar observations have been reported by Anderson et al. in the monitoring of real time transesterification of oils [59].
Free glycerin has been left over in very small amount in all the products.
Monitoring development, standardization and quality aspects of CRM of soya based biodiesel during their production process
The analytical strategies based on NMR and GC-MS techniques adopted for components profiling of vegetable oils, biodiesels and transesterified products including residual impurities were applied to the development of CRMs of soybean based biodiesel. This includes selection of base material of biodiesel, treatment of base material for neutralization of acid impurities and addition of antioxidant at required level. After the preparation, the CRM was packed in large numbers of ampoules for round robin testing of physico-chemical properties. Some of these ampoules were analyzed by NMR (1H, 13C) (500 MHz, 800 MHz), GC-MS, IR and potentiometery for monitoring and determination of the following quality parameters:
Ester content (EN14103, 1HNMR)
Iodine value (EN14111, 1HNMR)
Fatty acid profile (GC-MS, 1HNMR)
PUFAs (EN14103-GC-MS, 1HNMR)
linolenic (C18:3) (EN14103-GC-MS, 1HNMR)
Impurities (Mono, Di, Tri Glycerides) (MG, DG, TG), free glycerin (G) (NMR) and free fatty acid (FFA) (NMR, IR)
The commercially procured soybean based biodiesel for the preparation of CRM, designated as INM1, was analyzed by methods based on NMR, GC-MS and potentiometry techniques for the determination of above mentioned quality parameters. The 500 MHz 1H NMR spectra of sample INM1 as shown in the Figure 15a and 15b depict signals exactly identical in nature to those present in a soybean based biodiesel (Figure 3). The characteristic signals corresponding to unsaturated fatty ester C18:N=1-3 were found to appear at the chemical shift region of 2.77 ppm (C18:2), 2.81 ppm and 0.98 ppm (n-3 ω C18:3), and 2.0 ppm (C18:1). The intensities of these signals represent their relative amount present in a biodiesel and matched with those determined by GC-MS analyses (Table 1). The structural features were also identical to those observed in the standard NIST 2772 (soybean based CRM) as shown in the Figure 15a. The FTIR analyses did not show any band at 1705 cm-1 characteristic of free fatty acid. The spectral features resemble with structural features of a typical biodiesel comprising of both saturated and unsaturated fatty ester (2890, 1741, 900-1100 cm-1) (spectrum not shown).

Figure 15a: 500 MHz 1H NMR full spectra and expanded view of part spectra of INM1 base material for soybean based CRM and NIST 2772.

Figure 15b: 500 MHz and 800 MHZ 1H NMR expanded view of part spectra part spectra of INM1 base material for soybean based CRM.
The vertical and horizontal expanded part spectra in the region of 3.9-5.28 ppm show characteristic signals due to mono, di and tri glycerides (Figure 15b). The critical interpretation of the spectrum has revealed the presence of mostly I-MG and 1,2-DG whose nature were found to be similar to residual glycerides identified in case of transesterified products of different vegetable oils. The spectrum did not show signals characteristic of TG (4.27- 4.34 ppm) (peak 1 2); 1, 3-DG (4.05 ppm, peak 6’) and 2-MG (4.9 ppm, 3.85 ppm). The presence of 1-MG (3.91-3.97 ppm, 4.11-4.21 ppm, 3.60-3.71 ppm) (peaks 5, 6, 7) and 1,2 DG (4.32- 4.35 ppm, 4.2-4.26 ppm) (peak 8, 3, 4) were confirmed from the appearance of their characteristic signals. The concentration of these residual glycerides is higher compared to those observed in the CRM NIST2772b as evident from the intensities of these components shown in the same (Figure 15b).
The 1H NMR spectra of INM soybean based biodiesel recorded at 800 MHz instrument show highly resolved and intense signals compared to those recorded at 500 MHz (Figures 15b and 16).
Analyses of different samples of soya based CRM
The 500 MHz 1H NMR spectra of different ampoules of CRM designated INMETRO BATCH 1019, 2199, 2837, and 1309 prepared from feedstock INM1 following the guidelines of ISO 34/35 [2,3,9,66-68] as given in the (Figures 17a and 17b) show signals due to different functional groups characteristics of biodiesel. The nature of signals, particularly due to mno, di and tri glycerides, are identical to those appeared in the spectra of feedstock INM1 (Figure 15) and CRM NIST2772b and NIST2772c (Figure 16). The different samples (ampoules) of CRM were found to contain higher amount of residual glycerides in NISTc compared to those present in the CRM NIST2772b as indicated by their respective signal intensities.

Figure 16: HPLC chromatogram of the nine reference compounds in 50% aqueous methanol, measured at 370nm. Retention times for rutin, sutherlandin A, sutherlandin B, kaempferol-3-O-rutinoside, sutherlandin C, sutherlandin D, quercitrin, quercetin and kaempferol were 11.9, 12.7, 13.8, 15.3, 16.2, 17.0, 18.0, 26.2 and 28.1 minutes, respectively.

Figure 17a: 500MHz 1H NMR spectra of NIST2772 and samples of different ampoules of soybean based CRM.

Figure 17b: 500MHz 1H NMR expanded view of spectra of NIST2772 and samples different ampoules of soybean based CRM. Peak assignments are given in Table 2.
Determination of fatty acid composition and quality parameters by 1H NMR
The fatty acid composition and quality parameters of oils and biodiesels are usually determined by standard methods based on GC-MS and potentiometry as specified in the ASTM D6751 specification. As discussed in the introductory section, methods based on 1H NMR technique are direct, rapid and provide results with equivalent precision [1,11,17-21,47-56]. The unsaturated fatty acid composition, C18:N=1-3, is determined by derivation of mathematical equations taking into consideration the integrated intensities of various functional groups in the NMR spectrum. In the present studies different approaches have been adopted for direct determination of quality parameters with derivation of simple equations. The saturated (SFA) and unsaturated fatty acid (UFA) content, fatty acid composition (C18:N=1-3) and quality parameters such as ω n-3 linolenic (C18:3), PUFA, ester and iodine values (IV) of oils (EO), biodiesel (EBD) and transesterified products (TBD) were determined by the methods based on 1H NMR techniques [17-21,50]. These methods have been developed by correlation of integral intensities (II) of functional groups (FG) in the respective chemical shift regions characteristics of glycerides (TG), UFA, unsaturated hydrogen (CH=CH) (IV) and C18:N=1-3 in the 1H NMR spectra as marked in the Figures 2-5 and also compiled in the Table 3, with the parameters (P) predetermined by the standard methods specified in the ASTM D 6751 specification. Following equation A is used:
| Parameters | TG ITG |
BD IOCH3 |
IV IUS |
UFA IUFA |
PUFA IPF |
C18:1 IO |
C18:2 IL |
C18:3 ILA |
|---|---|---|---|---|---|---|---|---|
| Chemical Shift, ppm |
4.05-4.35 | 3.67 3.5-3.8 |
5.05- 5.65 |
1.9-2.1 | 0.98 0.94-1.013 |
2.0 | 2.77 | 2.81 or 0.94-1.013 |
| R2 | 0.989 | 0.957 | 0.928 | 0.856 | 0.984 | 0.984 | 0.978 | 0.958 |
TG=Triglycerides, BD=Biodiesel, IV=IODINE value, UFA=Unsaturated fatty acid/esters, SFA=Saturated fatty acid/esters, highlighted values are for center of peak, R2=Correlation between NMR and GC-MS (EN 14103, EN14111) methods, ITG, IOCH3 etc. are the integrated intensities of the respective chemical shift regions
Table 3: 1HNMR chemical shift regions of functional groups corresponding to quality parameters of oils and biodiesel.
P=KxIFG+INT (A)
where P is the parameter to be measured, IFG the integral intensities of the functional groups corresponding to a particular parameter in the characteristic chemical shift regions, K the proportionality constant and INT the intercept of the curve P vs. IFG.
The methods for derivation of these equations used for determination of parameters have been described in our previous published work [17-21,50,55]. The following equations were used:
TG=26.06x2xITG-0.6 (1) [20]
 (2)( [18]
C18:3 (α or γ) =10.75xILA (4) [21,49]
UFA (O+L+LA)=8.52xIUFA+4.14 (5)
SFA=100- UFA (6)
(C18:2) =17.35xIL +2.56 (7)
(C18:1)=UFA– (C18:2+ C18:3) (8)
Iodine Value (IV) = 15.78xIUS (9) [50]
The ITG, IOCH3 etc. are the integrated intensities in the chemical shift regions of functional groups corresponding to a particular parameter in the 1H NMR spectra of FAMES and oils as explained in the Table 3. The derivations of some of these equations (1-4 and 9) are described in our earlier work [17-21]. In order to illustrate the concept for the derivation of equation 7, the curve IL (2.77 ppm) vs. content of C18:2 determined by GC-MS for a large numbers of different biodiesel samples and their blends is plotted to determine the constant K. The values of constant K and intercept (INT) were determined to be 17.35 and 2.56 respectively. The quality parameters of oils and biodiesels including transesterified products, and different ampoules of soybean based CRM determined by the applications of the Eq1-9 are given in the Tables 4, 5.
| S.N | Samples of oil | IV | Ester | PUFA | UFA | SFA | C18:1 | C18:2 | C18:3 |
|---|---|---|---|---|---|---|---|---|---|
| 1 | Soya | 131.2 | 98.9 | 7.27 | 88.9 | 11.1 | 28.1 | 52.0 | 7.27 |
| 2 | Sunflower | 135.1 | 100.5 | nd | 92.4 | 7.6 | 28.1 | 64.3 | nd |
| 3 | Canola | 114.5 | 98.2 | 8.7 | 93.6 | 6.4 | 64.3 | 20.7 | 8.7 |
| 4 | Cotton | 110.1 | 96.6 | nd | 79.4 | 20.6 | 20.9 | 58.4 | nd |
| 5 | Corn | 116.5 | 93.6 | 2.2 | 86.6 | 13.4 | 31.9 | 52.5 | 2.2 |
Table 5: Fatty acid composition and quality parameters (%w/w) of oils by 1H NMR.
Statistical analyses of results by NMR and GCMS methods
The NMR results presented in the Table 4 were correlated statistically with the results obtained by GC-MS (EN14111and EN14103) presented in the Table 1. There are fairly good agreements obtained for ester content, iodine value, PUFA and unsaturated fatty acid composition as indicated by their respective regression coefficients, R2, compiled in the Table 3 (Figures 18a and 18b). The low iodine values obtained by EN 14111 method for some of the transesterified products, highlighted in bold, compared to NMR method have been ascribed to the presence of significant amount of water. The presence of water was confirmed by NMR analyses of these products. The presence of water will decrease the effective weight of sample to be considered for calculation of iodine values by the method EN 14111. However, this will not affect the analyses by NMR method [50]. Similarly, the low value of ester content by NMR in some of the transesterified products, highlighted in bold, is explained due to residual amount of water present in these samples. These samples have not been considered in the statistical analyses.
| Sample | IV NMR |
Ester | PUFA | UF A | SFA | C18:1 | C18:2 | C18:3 | IV-EN 14111 |
ITA- G | FGLY | BGLY |
|---|---|---|---|---|---|---|---|---|---|---|---|---|
| Cotton 0 m | 113.1 | 95.8a | nd | 73.5 | 26.5 | 15.6 | 57.9 | nd | 109.3 | 3.70 | nd | 9.9 |
| Cotton 1 m | 111.1 | 76.9 | nd | 76.9 | 23.1 | 20.6 | 56.3 | nd | 110.5 | 0.30 | 0.62 | 1.12 |
| Cotton 10 m | 110.5 | 89.3 | nd | 73.2 | 26.8 | 18.62 | 54.58 | nd | 104.2 | 0.38 | 0.43 | 1.42 |
| Cotton 15 m | 107.4 | 99.3 | nd | 73.1 | 26.9 | 18.56 | 54.54 | nd | 98.2 | --- | 0.53 | --- |
| Canola 0 m | 112.7 | 100.5a | 8.8 | 93.8 | 6.2 | 66.2 | 19.85 | 8.8 | 115.2 | 3.88 | nd | 10.3 |
| Canola 1 m | 113.2 | 78.8* | 8.4 | 91.1 | 8.9 | 62.8 | 20.07 | 8.4 | 106.7 | 1.19 | 0.64 | 4.46 |
| Canola 3 m | 110.9 | 89.6 | 8.7 | 90.5 | 9.5 | 61.6 | 20.76 | 8.7 | 107.8 | 0.48 | 0.73 | 1.80 |
| Canola 10 m | 113.0 | 91.8 | 8.5 | 88.6 | 11.4 | 60 | 20.4 | 8.5 | 107.9 | 0.22 | 0.80 | 0.82 |
| Canola 15 m | 110.9 | 90.4 | 8.7 | 89.5 | 10.5 | 60.6 | 18.68 | 8.7 | 107.1 | 0.20 | 0.68 | 0.75 |
| Corn 0 m | 118.4 | 98.4a | 2.0 | 84.1 | 15.9 | 33.3 | 48.8 | 2.0 | 117.3 | 3.80 | nd | 10.1 |
| Corn 1 m | 119.6 | 84.3 | 2.2 | 85.5 | 14.5 | 34.09 | 49.21 | 2.2 | 117.2 | 0.62 | 0.80 | 2.33 |
| Corn 3 m | 117.6 | 91.0 | 2.2 | 86.3 | 13.7 | 33.87 | 50.23 | 2.2 | 116.9 | 0.28 | 0.56 | 1.05 |
| Corn 10 m | 122.4 | 96.5 | 2.2 | 89.7 | 10.3 | 37.5 | 50.0 | 2.2 | 117.2 | 0.18 | 0.72 | 0.67 |
| Corn 15 m | 119.5 | 90.2 | 2.0 | 86.4 | 13.6 | 32.94 | 51.46 | 2.0 | 116.9 | 0.24 | 0.70 | 0.90 |
| SFL 0 m | 131.4 | 100.5a | nd | 92.9 | 7.1 | 25.09 | 67.81 | nd | 129.5 | 3.88 | nd | 10.3 |
| SFL 1 m | 127.8 | 65.1 | nd | 92.7 | 7.3 | 23.73 | 68.97 | nd | 124.5 | 1.12 | 1.15 | 4.20 |
| SFL3 m | 131.4 | 75.3 | nd | 89.7 | 10.3 | 21.94 | 67.76 | nd | 128.4 | 0.51 | 0.67 | 1.91 |
| SFL 10 m | 130.5 | 85.3 | nd | 91.7 | 8.3 | 24.12 | 67.59 | nd | 130.6 | 0.25 | 0.64 | 0.93 |
| SFL 15 m | 130.8 | 88.8 | nd | 89.5 | 10.5 | 21.57 | 67.94 | nd | 127.7 | 0.14 | 0.68 | 0.53 |
| SoyaBD | 128.4 | 98.1 | 7.7 | 87.0 | 13.0 | 26.27 | 53.03 | 7.7 | 124.7 | 0.11 | 0.12 | 0.41 |
| NIST 2772b | 134.1 | 99.8 | 8.3 | 87.8 | 12.2 | 24.3 | 55.20 | 8.3 | 134.3 | 0.04 | nd | 0.15 |
| NIST 2772c | 128.2 | 97.3 | 8.9 | 86.3 | 13.7 | 23.3 | 54.09 | 8.9 | 130.6 | 0.14 | nd | 0.53 |
| INM 1309 | 125.0 | 99.9 | 6.8 | 83.1 | 16.9 | 22.75 | 53.55 | 6.8 | 120.7 | 0.07 | nd | 0.26 |
| INM 2199 | 122.8 | 97.8 | 6.8 | 83.1 | 16.9 | 24.28 | 52.02 | 6.8 | 125.4 | 0.06 | nd | 0.22 |
| INM 2836 | 128.4 | 99.2 | 6.8 | 83.0 | 17.0 | 24.37 | 51.83 | 6.8 | 131.3* | 0.08 | nd | 0.30 |
| INM 1019 | 129.6 | 97.8 | 6.7 | 85.6 | 14.4 | 27.25 | 51.65 | 6.7 | 130.9* | 0.09 | nd | 0.34 |
| INM 2904 | 119.4 | 98.4 | 6.7 | 84.6 | 15.4 | 26.07 | 51.83 | 6.7 | ------ | 0.06 | nd | 0.23 |
| INM 1 | 128.1 | 98.1 | 7.0 | 83.8 | 16.2 | 24.59 | 52.21 | 6.3 | 127.2 | 0.1 | nd | 0.37 |
| Soycot | 118.3 | 94.3 | 3.3 | 82.7 | 17.3 | 26.15 | 53.25 | 3.3 | 115.9 | 0.15 | 0.08 | 0.56 |
| SoyO1 | 122.5 | 94.9 | 7.1 | 84.7 | 15.3 | 26.81 | 50.79 | 7.1 | --- | 0.08 | nd | 0.30 |
| SoyO2 | 126.4 | 98.4 | 7.5 | 85.2 | 14.8 | 26.2 | 51.60 | 7.4 | --- | --- | nd | --- |
| UFA and SFA=Unsaturated and saturated fatty acids, ITAG=Integral intensities of residual glycerides in the region of 4-4.4 ppm, FGLY and BGLY=Free and binded glycerin determined by equations 20 and 19, *by GC-MS [50], highlighted bold values indicate effect of residual water, nd=Not detectable, a=Ester content by equation 1, the ester (BD) content in the transesterified products and biodiesel (BD) by equation 2, SoyO1 and SoyO2 are samples of biodiesel from different soybean oils, --- data not generated, b and c are different batches of CRM NIST2772. | ||||||||||||
UFA and SFA=Unsaturated and saturated fatty acids, ITAG=Integral intensities of residual glycerides in the region of 4-4.4 ppm, FGLY and BGLY=Free and binded glycerin determined by equations 20 and 19, *by GC-MS [50], highlighted bold values indicate effect of residual water, nd=Not detectable, a=Ester content by equation 1, the ester (BD) content in the transesterified products and biodiesel (BD) by equation 2, SoyO1 and SoyO2 are samples of biodiesel from different soybean oils, --- data not generated, b and c are different batches of CRM NIST2772.
Table 4: Fatty acid composition and quality parameters (% w/w) of oils, transesterified products and biodiesels by equations 1-9 and 14-20 based on 1H NMR methods.

Figure 18a: Correlation curves of results by NMR and GC-MS methods for unsaturated fatty acids (C18:N=1-3).

Figure 18b: Correlation curves of results by NMR and GC-MS (ester content), and potentiometry (Iodine value, IV) methods.
Quantitative residual glycerides profiling by 1H NMR
As discussed in the proceeding sections, five types of residual glycerides such as 1 and 2 mono glycerides (1-MG, 2-MG); 1,2 and 1, 3 diglycerides (1,2-DG; 1,3-DG); and tri glyceride (1,2,3- TG) have been identified in the biodiesels as well transesterified products. The identities of glycerides are independent of types of oils or biodiesel. The 2-MG has been identified in very small amount and that too in few products of corn and cotton oils. The 13C NMR analyses have also identified these types of residual glycerides besides the presence of free glycerin. In order to make assessment of the distribution of different types of residual glycerides in the transesterified products of different oils, a curve of integrated intensities (II) (NMR-II) corresponding to different glycerides (mono, di and tri) vs. transesterified products of cotton, sunflower, canola and corn oils at different interval of times were plotted (Figure 19). The NMR-II is the intensity of one hydrogen each of respective functional groups of mono (IMG), di (I12DG ), I13DG and tri (I123TG) glycerides in their respective chemical shift regions, and represents the mole percentages present in transesterified products as mentioned in the following equations:

Figure 19: Distribution of mono, di and tri glycerides (NMR-Mol%) in the transesterified products (biodiesls, BD) of different oils (sunflower, canola, cotton and corn) at different intervals of reaction time.
1MG(mol%)= IMG(3.91–3.97 ppm) (10)
1,2DG(mol%)=I12DG(5.0–5.12 ppm or 4.2–4.26 ppm) (11)
1,3DG(mol%)= I13DG(4.1–4.23 ppm) (12)
1,2,3 DG(mol%)= I123TG(4.27–4.34 ppm) (13)
The graphical representation shows that 1, 3-DG has been generated in quite higher amount and 1.2-DG being the lowest among other glycerides. Similar trend has been observed in the transesterified products of all types of oil investigated. As shown in Figure 20, similar results have been obtained in case of different ampoules of soybean based CRM and biodiesel samples (SoyaBD, SoyCot, SoyO1 and SoyO2). The amount of 1, 2, 3-TG was found to be negligible in all the ampoules including CRM NIST 2772b. The contents of residual glycerides are in the same range as observed in case of CRM NIST 2772b. The 13C-DEPT NMR analyses corroborate the findings by 1H NMR analyses with regard to the amount of different glycerides generated, and show the following trend (Figure 14).

Figure 20: Distribution of mono, di and tri glycerides (NMR-Mol%) in the different ampoules of soybean based CRM (INM,1309, 2199, 2837, 1019, 2904) and samples of soybean biodiesel
1, 3-DG or 1, 2, 3-TG>1-MG>1, 2-DG
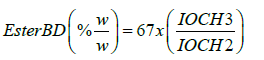
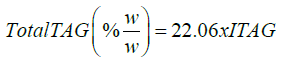
The Maximum contents (Max % m/m) of mono (MG), di (DG), tri (TG) glycerides and free glycerin permitted in a biodiesel are 0.8%, 0.2%, 0.2% and 0.02% m/m respectively as specified in the standard EN 14214. This allows maximum content of free and bound glycerin 0.25 % m/m to be present in a biodiesel. The content of residual glycerides permitted has been calculated based on C18:0 TAG (Table 6). Based on this significant information available, analytical strategies based on integrated intensities (II-NMR) of functional groups of mono, di and tri glycerides in the chemical shift regions of 4.0-4.4 ppm have been worked out to quantitatively determine the free and bound glycerin in the different ampoules of soybean based CRM, and few samples of edible oil based biodiesel. The strategies are discussed below:
| TAG | TG C18:0 |
DG | MG | GLY | Average |
|---|---|---|---|---|---|
| MWT | 891.43 | 630 | 360.78 | 92 | - |
| GLY (%w/w) | 10.3 | 14.6 | 25.5 | - | - |
| B-GLY | 0.103 | 0.146 | 0.255 | - | 0.17 |
| Max, % w/w | 0.2 | 0.2 | 0.8 | 0.02 | - |
| H | 110 | 75 | 40 | - | - |
| F-NMR TAG | 110/4=27.5 | 75/4=18.75 | 40/2=20 | - | 22.06 |
TG=Tri glycerides,DG=Di glycerides, MG=Mono glycerides, B-GLY is a factor for bound glycerin, GLY=Glycerin, F-NMR TAG is a factor for TAG (mono + di + tri) in transesterified products
Table 6: Maximum content (Max % m/m) of mono (MG), DI (DG) and Tri (TG) permitted in a biodiesel as per EN 14214 specification and NMR factors.
The four hydrogen of acyl groups attached to fatty acid chain of 1,3-DG, 1,2-DG and 1,2,3-TG depict signals in the region of 4-4.4 ppm and 5.1 ppm, and two hydrogen of acyl group attached to fatty acid chain of 1-MG at 4.2-4.4 ppm. Based on number of hydrogens present in the different C18:0 TAGs (110, 75, and 40), the factors, F-NMR, have been calculated as per the following equations and used for estimation of bound glycerin (BGLY) (Table 2).
 (14)
(14)
 (15)
(15)
 (16)
(16)
F – NMR(average of mono, di and tri ) = 0.333(27.5+18.75+20) =22.06 (17)
 (18)
(18)
BGLY=TAGx0.17 (19)
where ITAG is the sum of integral intensities in the region of 4.0- 4.4 ppm in the 1H NMR spectra, TAG are the average content of mono, di and triglycerides present in a sample, and factor 0.17 is the average factor of estimation of bound glycerin as described in Table 6.
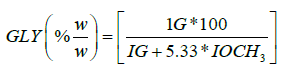
The signals due to hydrogens of free glycerin appear at 3.49 ppm in the 1H NMR spectra of biodiesels as shown in the Figures 10-13 of transesterified products. The integral intensities of the region of 3.49 ppm, molecular weight of glycerin (92) and average molecular weight of biodiesel 294 [50] have been used for the derivation of following equation for the estimation of free glycerine (GLY):
 (20)
(20)
where IG and IOCH3 are the integral intensities due to glycerin and methoxy group (OCH3) of biodiesel at their respective chemical shift values of 3.49 ppm and 3.67 ppm respectively. The results of bound glycerin and free glycerin of soybean based CRM, biodiesel and transesterified products estimated by the equations 14-20 are given in the (Table 4).
The correlation of integral intensities in the region of 3.8-4.4 ppm corresponding to residual glycerides of different sampoules of soybean based CRM and NIST 2772 as shown in the (Figure 21), indicate that integral intensities in the range of 0.04-0.07% (0.88-1.5 % w/w of glycerides) can be considered for quality assessment meeting ASTM 6751 specification with regards to the specification of residual glycerides. It is also interesting to note that the two batches of samples of CRM NIST2772, marked NIST2772b and NIST2772c, are found to contain different types and contents of residual glycerides. The NIST2772c sample contains TG besides mono and di glycerides in contrast to NIST2772b, which contains only mono and di glycerides. The bound glycerin has been estimated to be 0.15 and 0.53% w/w respectively in these samples (Table 4).

Figure 21: Curve of NMR-II (%) of TAG(mono +di +tri ) vs. different samples of CRMs and final transesterified products (biodiesel) of different oils in the chemical shift region of 3.8-4.4 ppm. SFL=sunflower, canl=canola, NISTa and NISTb= different batches of CRM NIST 2772.
Validation of results by equations 1-9
The results of ester contents of oil and biodiesel, and iodine values of samples including transesterified products were validated by comparison with the results obtained by standard methods based on GC-MS as specified in the standard ASTM6751/EN14214 as described previously [20,50]. The method of cross validation by regression analyses was adopted. However, only simple regression analyses was applied to determine the R2 values for PUFA and unsaturated fatty acid composition (C18: N=1-3). The equations for PUFA and fatty acid composition (Eq 3-8) were developed based on correlation of results by NMR and standard GC-MS methods. The validation process is being developed and results will be published in due course of time.
Precision of NMR Methods
Methods based on NMR techniques provide accurate results with acceptable precision compared to methods based on GC and GCMS techniques. The accuracy of determination is dependent of the accuracy of determination of integrated intensities (II) or area of functional groups in a NMR spectrum. Due to high resolution and sensitivity inherited with the high field NMR instruments, the II can be measured by accuracy of approximately 1% [50].
The repeatability standard deviation (%SD) of NMR methods for the determination of quality parameters such as ester content, oil content (TG), iodine values, PUFAs etc. of B100 biodiesel and transesterified products of vegetable oils samples as mentioned in the Tables 4 and 5 were determined and compared with those of EN14111 (iodine values) and EN14103 (ester content). Each sample was recorded three times or the FID was processed three times by proper adjustment of base line and phase, and integrated the chemical shift regions of different functional groups corresponding to various quality parameters (Tables 2 and 3). The quantitative spectral recording and processing protocol was followed as discussed in our earlier work [50]. Results given in the Table 7 showed that the NMR method provided equivalent results with acceptable precision compared to standard methods (RSD=0.21 each for ester and C18:3 contents by EN14103 and 3 units of iodine value for EN14111). The higher values of SD (9.96- 20.14%) of TAG (mono + di + tri glycerides) were calculated for samples of biodiesel and transesterified products having very low II in the range of 0.04-0.15%. It is difficult to measure conveniently such a low value of II due to problems faced in adjustment of phase and base line corrections.
| Sample | IV | Ester BD |
Ester TG |
PUFA C18:3 |
C18:2 | UFA | TAG | GLY |
|---|---|---|---|---|---|---|---|---|
| Canola oil | 0.26 | - | 0.271 | 1.94 | 0.286 | 0.575 | nd | np |
| Sunflower oil | 0.06 | - | 0.152 | np | 0.280 | 1.94 | nd | np |
| Cotton oil | 0.609 | - | 0.285 | np | 0.815 | 1.296 | nd | np |
| Soya oil | 0.16 | - | 0.265 | 1.57 | 0.277 | 0.321 | nd | np |
| Soya BD | 0.151 | 0.141 | ---- | 1.612 | 0.459 | 0.529 | 20.143 | nd |
| Soy-Cot BD | 0.273 | 0.193 | ---- | 3.782 | 2.50 | 0.634 | 9.962 | nd |
| Canola BD | 0.294 | 0.121 | ---- | 2.721 | 0.709 | 0.556 | nd | nd |
| INM1 BD | 0.321 | 0.121 | ---- | 3.600 | 0.156 | 0.112 | 11.111 | nd |
| INMETRO 1309 | 0.076 | 0.071 | ---- | 1.538 | 0.294 | 0.891 | 13.092 | nd |
| NIST 2772c | 0.451 | 0.700 | 0.597 | 1.814 | 0.405 | 0.578 | 12.062 | nd |
| NIST 2772b | 0.151 | 0.682 | nd | 1.613 | 0.168 | 0.374 | 18.321 | nd |
| SFL 1 Min | 0.592 | 0.794 | 2.272 | np | 1.810 | 1.254 | 0.952 | 2.468 |
| SFL 3 Min | 0.56 | 0.471 | 5.092 | np | 0.859 | 0.154 | 1.237 | 3.329 |
| SFL 15 Min | 0.187 | 0.295 | 10.178 | np | 0.281 | 0.151 | 3.535 | 2.039 |
| Canola 1 Min | 0.336 | 0.873 | 4.981 | 1.410 | 0.567 | 0.346 | 1.000 | 4.000 |
| Canola 5 Min | 0.084 | 0.426 | 5.968 | 1.098 | 0.292 | 0.409 | 3.125 | 1.549 |
| Canola 15 Min | 0.149 | 0.277 | 1.660 | 1.894 | 0.305 | 0.407 | 2.934 | 2.03 |
IV= Iodine value, BD=Biodiesel, TAG=mono + di +tri glycerides, UFA=Unsaturated Fatty Acids, TG=Tri glycerides, nd=Not detectable, np=Not present, NIST2772b and NIST2772c are different batches, ---- not determined, GLY=Free glycerin
Table 7: Repeatability Standard Deviation (%SD) of quality parameters by 1H NMR.
Conclusions
Analytical strategies adopted based on high field NMR spectroscopic techniques have enabled to develop rapid and convenient methods for component analyses and quality assessment of samples of CRM of soybean based biodiesl, and biodiesl samples from edible oils including transesterified products. The 500 and 800 MHz NMR spectroscopic techniques (1H, 13C, 13C-DEPT) provide structural features characteristic of oil and biodiesel. The unsaturated fatty acid/esters, C18:1, C18:2 and C18:3, depict separate signals, which enable their characterization quantitatively. The sensitivity and resolution of these signals were found to enhance significantly at 800 MHz NMR spectrometer to facilitate direct observation and identification without resorting to treatment by complex mathematical equations as was the case with 500 MHz instrument. The signals due to residual glycerides (mono, di, tri) and free glycrin are clearly observed with a little overlapping at 500MHz 1H NMR spectral analyses. The 1H and 13C-DEPT spectral analyses of transesterified products of biodiesel have revealed the presence of five types of residual glycerides (AGs) such as TG, 1,2-DG, 1,3-DG, 1-MG and 2-MG appearing at their characteristic chemical shift regions. The results presented in the Tables 4 and 5, show that methods based on NMR provide results of quality parameters of biodiesel specified in the ASTM D6751 with acceptable precision as demonstrated by their regression analyses and %SD. The ester, PUFA, and linolenic acid (C18:3) contents, iodine value (IV) and fatty acid profile (C18:N=1-3) determined by newly developed methods based on NMR provide results comparable to those determined by standard methods specified in the ASTM D 6751 specification as indicated by treatment of data statistically.
(R2=0.927-0.989). All these parameters can be determined from a single 1H NMR spectrum of a biodiesel sample without any chemical treatment. The critical interpretation and assignment of signals due to mono, di, tri glycerides in the chemical shift regions of 4-5.26 ppm have facilitated the development of equations for the direct estimation of bound and free glycerin. The results of different ampoules of soybean based CRM, and biodiesels of soybean, canola, sunflower and cotton oils have indicated that % integrated intensities in the region of 4-4.4 ppm due to acyl groups of residual glycerides can be used for taking decision about samples of CRM meeting specification (Figure 21). These parameters can be used for quality assessment and certification of CRM of biodiesel prepared from different feedstocks.
References
- Tyagi OS, Atray N, kumar B, Datta A (2010) Production, Characterization and Development of Standards for Biodiesel - A Review. MAPAN Jr of Metrolgy Society of India 5: 197-218.
- Silva VF, Fonseca MG, Pissurno ECG, Rocha WFC, Caixeiro JMR, et al. (2012) Brazilian Biodiesel for Certified Reference Material: Evaluation of Short-Term Stability of the Iodine Value and Oxidative Stability. 20th European Biomass Conference and Exhibition, pp: 2303-2305.
- Ulberth BM, Potalivo M, van der Veen AMH, Hugo E, Baldan A, et al. (2013) The BIOREMA project-Part 2: International interlaboratory comparison for biodiesel test methods. Accred Qual Assur 18: 29-39.
- Morales BV, Goren AC, Held A, Bilsel M, Gundu’z S, et al. (2015) Validation of a GC-IDMS method for the metrologically traceable quantification of selected FAMEs in biodesel. Accred Qual Assur 20: 411-419.
- Ulberth BM, Morales V, Charoud GJ, Emteborg H, Held LA (2014) The certification of the mass fraction of the ester, linolenic acid methyl ester, monoglyceride, diglyceride, triglyceride, total glycerol and water content, density, viscosity, oxidation stability, acid value, iodine value and flash point of biodiesel: ERM®-EF001. EUR-Scientific and Technical Research series, p: 88.
- Ulberth BM (2015) New certified biodiesel reference materials for effective biodiesel testing. Energy Fuels 29: 3732-3738.
- Ulberth BM, Potalivo M, Emteborg H, Held A (2011) Toward the Development of Certified Reference Materials for Effective Biodiesel Testing. Part 1: Processing, Homogeneity, and Stability. Energy Fuels 25: 4622-4629.
- Ulberth BM, Potalivo M, Held A (2011) Toward the Development of Certified Reference Materials for Effective Biodiesel Testing. Part 2: Characterization and Value Assignment. Energy Fuels 25: 4630-4637.
- Jornada J (2009) Metrology Challenges for Biofuels. IMEKO XIX World Congress Lisbon.
- European association of national metrology institutes-ENG09 JRP BIOFUELS Final Publishable JRP Report.
- Meher LC, Sagar VD, Naik SN (2004) Technical aspects of biodiesel production by transesterification-a review. Renewable and Sustainable Energy Reviews, pp 1-21.
- McCormick RL, Ratcliff M, Moens L, Lawrence R (2007) Several factors affecting the stability of biodiesel in standard accelerated tests. Fuel Processing Technology 88: 651-657.
- Banga S, Varshney, PK (2010) Effect of impurities on the performance of biodiesel. JSIR 69: 575-579.
- Kivevele TT, Mbarawa MM, Bereczky A, Laza T, Madarasz J (2011) Impact of antioxidant additives on the oxidation stability of biodiesel produced from Croton Megalocarpus oil. Fuel Processing Technology 92: 1244-1248.
- Ibeto CN, Ofoefule AU, Ezuegwu HC (2011) Analytical methods for quality assessment of biodiesel from animal and vegetable oils-A Review. Trends in Applied Science Research 6: 537-553.
- Masson l (2015) Fatty acid composition of soybean/sunflower mix oil, fish oil and butterfat applying the AOCS Ce 1j-07 method with a modified temperature program. GRASAS Y ACEITES 66: e064.
- Sarpal AS, Costa ICR, Teixeira CMLL, Filocomo D, Candido R, et al. (2016) Investigation of Biodiesel Potential of Biomasses of Microalgaes Chlorella, Spirulina and Tetraselmis by NMR and GC-MS Techniques. J Biotechnology Biomaterial 6: 1-15.
- Kumar R, Bansal V, Patel MB, Sarpal AS (2014) Compositional Analysis of Algal Biomass in a Nuclear Magnetic Resonance (NMR) Tube. JABU 5: 36-45.
- Sarpal AS, Silva PRM, Pinto RF, Cunha VS, Daroda RJ, et al. (2014) Biodiesel potential of oleaginous yeast biomass by NMR spectroscopic techniques. Energy Fuels 28: 3766-3777.
- Sarpal AS, Teixeira CMLL, Silva PRM, Lima GM, Silva SR, et al. (2015) Determination of lipid content of oleaginous microalgae biomass by NMR spectroscopic and GC-MS techniques. Analytical Bioanalytical Chemistry 407: 3799-3816.
- Sarpal AS, Teixeira CMLL, Silva PRM, Monteiro TV, Itacolomy J, et al. (2015) NMR techniques for determination of lipid content in microalgal biomass and their use in monitoring the cultivation with biodiesel potential. Applied Microbiology Biotechnology.
- Luykx DMAM, Ruth SMV (2008) An overview of analytical methods for determining the geographical origin of food products. Food Chemistry 107: 897-911.
- Bajoub A, Medina RS, Hurtado FE, Ajal EA, Ouazzani N, et al. (2015) A first approach towards the development of geographical origin tracing models for North Moroccan olive oils based on triacylglycerols profiles. European Journal of Lipid Science and Technology.
- Knothe G (2001) Analytical methods used in the production and fuel quality assessment of biodiesel. Transaction of ASAE 44: 193-200.
- O’Donnell S, Demshemino I, Yahaya M, Nwadike I, Okoro L (2013) A review on the Spectroscopic Analyses of Biodiesel. European International Journal of Science and Technology 2:137-146.
- Vukovic JP (2016) Application of NMR Spectroscopy in the Analysis of Biodiesel-Review. Chemistry in Industry 65: 17-24.
- Monteiro MR, Ambrozin ARP, Liãob LM, Ferreira AG (2008) Critical review on analytical methods for biodiesel characterization. Talanta 77: 593-605.
- Murugesan A, Umarani C, Chinnusamy TR, Krishnan M, Subramanian R, et al. (2009) Production and analysis of bio-diesel from non-edible oils-A review. Renewable and Sustainable Energy Reviews 13: 825-834.
- Ghesti GF, De Macedo JL, Resck LS, Dias JA, Dias SCL (2007) FT-Raman Spectroscopy quantification of biodiesel in a progressive soybean oil transesterification reaction and its correlation with 1H NMR spectroscopy methods. Energy Fuels 21: 2475-2480.
- Oliveira FCC, Brandao CRR, Ramalho HF, Leonardo da Costa LAF, Suarez PAZ, et al. (2007) Adulteration of diesel/biodiesel blends by vegetable oil as determined by Fourier transform (FT) near infrared spectrometry and FT-Raman spectroscopy. Analytica Chimica Acta 587: 19-199.
- Guerrero A, Anguebes F, Castelán M, Morales V, García R, et al. (2013) FTIR-ATR and Multivariate Calibration for the prediction of biodiesel concentration in petrodiesel blends. American Journal of Analytical Chemistry 4: 343-347.
- Oliveira JS, Montalvao R, Daher L, Suarez PAZ, Rubim JC (2006) Determination of methyl ester contents in biodiesel blends by FTIR-ATR and FTNIR spectroscopies. Talanta, pp 1-7.
- Peña AM, Franseschi FA, Estrada MC, Ramos VM, Zarracino RG, et al. (2014) Fourier transform infrared-attenuated total reflectance (FTIR-ATR) spectroscopy and chemometric techniques for the determination of adulteration in petrodiesel/biodiesel blends. Quím Nova, p: 37.
- Rabelo SN, Ferraz VP, Oliveira LS, Franca AS (2015) FTIR Analysis for quantification of fatty acid methyl esters in biodiesel Produced by Microwave-Assisted Transesterification. International Journal of Environmental Science and Development 6: 964-969.
- Eberlin LS, Abdelnur PV, Passero A, de Sa GF, Daroda RJ, et al. (2009) Analyses of biodiesel-petrodiesel blends by high performance thin layer chromatography combined with easy ambient sonic-spray ionization spectrometry. Analyst 134: 1652-1657.
- Shang NC, Liu RZ, Chen YH, Chang CY, Lin RH (2012) Characterization of fatty acid methyl esters in biodiesel using high-performance liquid chromatography. J Taiwan Inst Chem43: 354-359.
- Trathnigg B, Mittelbach M (1990) Analysis of triglyceride methanolysis mixtures using isocratic HPLC with 8 9 6 density detection. J Liq Chromatogr 13: 95-105.
- Holcapek M, Jandera P, Fischer J, Prokes B (1999) Analytical monitoring of the production of biofuel by high 900 performance liquid chromatography with various detection methods. J Chromatogr 858: 13-31.
- Li Y, Bao G, Wang H (2008) Determination of 11 fatty acids and fatty acids methyl esters in biodiesel using ultra performance liquid chromatography. Chinese J Chromatogr 26: 494-498.
- Ramos MJ, Fernández CM, Casas A, Rodríguez L, Pérez A (2009) Influence of fatty acid composition of raw materials on biodiesel properties. Bioresource Technology 100: 261-268.
- Catharino RR, Haddad R, Cabrini LG, Cunha IBS, Sawaya ACHF, et al. (2006) Characterization of Vegetable Oils by Electrospray Ionization Mass Spectrometry Fingerprinting: Classification, quality, adulteration, and aging Anal Chem 77: 7429-7433.
- Gromadzka J, Wardencki W (2011) Trends in Edible Vegetable Oils Analysis. Part A. Determination of different components of edible oils-a Review Pol. J Food Nutr Sci 61: 33-43.
- Fernandes AMAP, El Khatib S, Cunha BS, Porcari AM, Eberlin MN, et al. (2015) Chemical characterization of jatropha curcas L seed oil and Its Biodiesel by Ambient Desorption/Ionization Mass Spectrometry. Energy Fuels 29: 3096-3103.
- Cozzolino R, Giulio BD (2011) Application of ESI and MALDI-TOF MS for triacylglycerols analysis in edible oils Eur. J Lipid Sci Technol 113: 160-167.
- Li L, Han J, Wang Z, Liu J, Wei J, et al. (2014) Mass Spectrometry Methodology in Lipid Analysis-Review. Int J Mol Sci 15: 10492-11105.
- Baiocchi C, Medana C, Bello FD, Giancotti V, Aigotti R, et al. (2015) Analysis of regioisomers of polyunsaturated triacylglycerols in marine matrices by HPLC/HRMS. Food Chemistry 166: 551-560.
- Anderson LA, Fran AK (2012) Real-Time Monitoring of Transesterification by 1H NMR Spectroscopy: Catalyst Comparison and Improved Calculation for Biodiesel Conversion. Energy Fuels 26: 6404-6410.
- Kumar R, Bansal V, Tiwari AK, Sharma M, Puri SK, et al. (2011) Estimation of glycerides and free fatty acid in oil extracted from seed for biodiesel production by NMR Spectroscopic techniques. J Am Oil Chem Soc 88: 1675-1685.
- Chopra A, Singh D, Kumar R, Sugmaran V, Sarpal AS (2011) Determination of Polyunsaturated Fatty Esters (PUFE) in biodiesel by GC/GC-MS and NMR techniques. J Am Oil Chem Soc 88: 1285-1296.
- Sarpal AS, Silva PRM, Silva SR, Monteiro TV, Itacolomy J, et al. (2015) A Direct Method for the determination of iodine value of biodiesel by Quantitative Nuclear Magnetic Resonance (q1H-NMR) Spectroscopy. Energy Fuels 29: 7956-7968.
- Nieva EB, Goicoechea E, Manzanos MJ, Guillén MD (2014) A method based on 1H NMR spectral data useful to evaluate the hydrolysis level in complex lipid mixtures. Food Research International 66: 379-387.
- Horst MT, Urbin S, Burton R, MacMillan C (2009) Using proton nuclear magnetic resonance as a rapid response research tool for methyl ester characterization in biodiesel. Lipid Technology 21: 1-7.
- Skiera C, Steliopoulos P, Kuballa T, Holzgrabe U, Diehl B (2012) Determination of free fatty acids in edible oils by 1H NMR spectroscopy. Lipid Technology 24: 279-281.
- Fang G, Goh JY, Tay M, Lau HF, Li SF (2013) Characterization of oils and fats by 1H NMR and GC/MS fingerprinting: Classification, prediction and detection of adulteration. Food Chemistry 138: 1461-1469.
- Sarpal AS, Silva SR, Monteiro TV, Silva PRM, Cunha VS, et al. (2015) Investigation of biodiesel potential and quality aspects of vegetable oils and microalgae biomass by NMR techniques. Modern ENV Science and Engineering, accepted November 2015.
- Nadai DV, Simões JB, Gatts CEN, Miranda PCML (2013) Inference of the biodiesel cetane number by multivariate techniques. Fuel 105: 325-330.
- Flores IS, Godinho MS, De Oliveira AE, Alcantara GB, Monteiro MR, at el. (2012) Discrimination of biodiesel blends with 1H NMR spectroscopy and principal component analyses. Fuel 99: 40-44.
- Hatzakis E, Agiomyrgianaki A, Kostidis S, Dais P (2011) NMR Spectroscopy: An Alternative Fast Tool for Qualitative and Quantitative Analysis of Diacylglycerol (DAG) Oil. Jr Oil & Fat Industries 88: 1695-1708.
- Anderson LA, Franz AK (2012) Real-Time Monitoring of Transesterification by 1H NMR Spectroscopy: Catalyst Comparison and Improved Calculation for Biodiesel Conversion. Energy Fuels 26: 6404-6410.
- Knoth G (2000) Monitoring a progressing transesterification reaction by Fiber-Optic Near Infrared spectroscopy with correlation to 1H Nuclear Magnetic Resonance spectroscopy. J Am Oil Chem Soc 77: 489-493.
- Berrios M, Skelton RL (2008) Comparison of purification methods for biodiesel. Chemical Engineering Journal 144: 459-465.
- Bardet M, Foray MF, Robert D (1995) Use of the DEPT pulse sequence to facilitate the 13C NMR structural analysis of lignins. Macromolecular Chemistry and Physics 186: 1495-1504.
- Vlabhov G (2009) 13C Nuclear Magnetic Resonance spectroscopy to determine fatty acid distribution in triacylglycerols of vegetable oils with High - Low Oleic Acid and High Linolenic Acid. The Open Magnetic Resonance Journal 2: 8-19.
- Botella L, Bimbela F, Martín L, Arauzo J, Sánchez JL (2014) Oxidation stability of biodiesel fuels and blends using the Rancimat and PetroOXY methods. Effect of 4-allyl-2, 6-dimethoxyphenol and catechol as biodiesel additives on oxidation stability. pp: 1-9.
- Catharino RR , Haddad R , Cabrini LG , Cunha IBS , Sawaya ACHF, et al. (2006) Characterization of Vegetable Oils by Electrospray Ionization Mass Spectrometry Fingerprinting: Classification, Quality, Adulteration, and Aging. Anal Chem 77: 7429-7433.
- Weber M, Hellriegel C, Rueck A, Wuethrich I, JenksSigma P (2014) Using high-performance1H NMR (HP-qNMR) for the certification of organic reference materials under accreditation guidelines-Describing the overall process with focus on homogeneity and stability assessment. Journal of Pharmaceutical and Biomedical Analysis 93:102-110.
- Janaína M, Rodrigues C (Laboratório de Análise Orgânica – LABOR Divisão de Metrologia Química) – DQUIM, INMETRO, Junho/2008. The Brazilian NMI Experience on Production and Certification of Reference Materials-Ethanol and Biodiesel Examples.
- Catharino RR, Milagre HMS, Saraiva S, Garcia CM, Schuchardt U, et al. (2007) Fast Biodiesel Typification and Quality Control by Direct Infusion Electrospray Ionization Mass Spectrometry Fingerprinting. Energy and Fuels 21: 3698.

Open Access Journals
- Aquaculture & Veterinary Science
- Chemistry & Chemical Sciences
- Clinical Sciences
- Engineering
- General Science
- Genetics & Molecular Biology
- Health Care & Nursing
- Immunology & Microbiology
- Materials Science
- Mathematics & Physics
- Medical Sciences
- Neurology & Psychiatry
- Oncology & Cancer Science
- Pharmaceutical Sciences