Measuring Leak Rates from Abandoned Natural Gas Wells in Western Pennsylvania
John L. Bradshaw, Jeremy M. Slagley, Nicole Iannacchione, and Matt Lees
Published Date: 2018-01-29DOI10.21767/2472-1948.100014
Bradshaw JL1*, Slagley JM2, Iannacchione N3 and Lees M1
1Department of Physics, Indiana University of Pennsylvania, Indiana, USA
2USAF AETC AFIT/ENV, Air Force Institute of Technology, 2950 Hobson Way WPAFB, USA
3Department of Safety Sciences, Indiana University of Pennsylvania, Indiana, USA
- *Corresponding Author:
- John L. Bradshaw
Department of Physics
Indiana University of Pennsylvania
56 Weyandt Hall, 975 Oakland Avenue, Indiana, USA
Tel: (724) 357-7731
E-mail: bradshaw@iup.edu
Received Date: October 03, 2017; Accepted Date: January 20, 2018; Published Date: January 29, 2018
Citation: Bradshaw JL, Slagley JM, Iannacchione N, Lees M (2018) Measuring Leak Rates from Abandoned Natural Gas Wells in Western Pennsylvania. J Sci Ind Metrol 2:1. doi: 10.21767/2472-1948.100014
Abstract
The proliferation of unconventional natural gas drilling has brought considerable recent attention to the possible impacts that this new technology may have on greenhouse gas emissions. In Pennsylvania, estimates of these possible impacts are very difficult to accurately assess in large part due to the highly uncertain contribution from legacy abandoned and orphaned gas (AOG) wells. This paper outlines our work in establishing a methodology for measuring the methane leak rate from AOG wells in Western Pennsylvania. The theory and methodology of an enclosure method for measuring the methane mass leak rate from one AOG natural gas well is described. Summary data for four other measurements and three other wells is presented. The goal of this work is to take the first steps towards an accurate determination of the contribution of AOWs to anthropogenic methane emissions in Pennsylvania.
https://marmaris.tours
https://getmarmaristour.com
https://dailytourmarmaris.com
https://marmaristourguide.com
https://marmaris.live
https://marmaris.world
https://marmaris.yachts
Keywords
Methane; Natural gas; Abandoned wells; Orphaned wells; Leaking well; Leak rate
Introduction
Methane is the second-largest contributor to the atmospheric greenhouse effect after carbon dioxide. Yet the atmospheric lifetime of methane is only 12 years, by far the smallest of any of the major greenhouse gases. Thus, control and regulation of anthropogenic methane emissions could have the fastest impact on greenhouse gas effects. In Pennsylvania, oil and natural gas drilling has been ongoing for over 150 years and during much of this time as a very lightly regulated industry. As a result, estimates of abandoned and orphaned gas (AOG) wells in Pennsylvania range from 280,000 to 970,000 wells [1]. (Orphaned wells are abandoned gas wells with no responsible party other than the state.) Emissions from AOG wells nationally are assumed to be the second largest contributor to U.S. methane emissions [2]. Thus, there are two challenges to accurately estimating the total methane flux from AOG wells in Pennsylvania. The first challenge is to improve the accuracy of the estimate of the number of AOG wells. The second challenge is to obtain an accurate estimate of the average methane mass flux from an AOG well.
In a recent study Kang et al. [1,3] made methane mass flux measurements from 42 wells in Pennsylvania. Methane mass fluxes in mg/hr from these wells varied by a factor of nearly 106. With a range this large a significantly larger number of AOG wells need to be measured to get statistically accurate estimates of the average and variation in the methane flux of these wells. This paper describes our work in establishing a methodology for measurement of methane mass fluxes from AOG wells in western Pennsylvania.
Methodology
There are two primary methods for determination of methane mass flux from AOG wells. We will refer to these methods as the direct method and the enclosure method. Because each method has advantages and disadvantages and to put the two methods into proper context, we will first briefly describe the method not used in this study, the direct method.
Direct method
A schematic diagram of a gas well head is shown in Figure 1. The well head may have one or more pipes open to the atmosphere or it may be a plugged well in which the pipes are back-filled with cement to an unknown depth beneath the ground.

Figure 1: A schematic diagram of a natural gas well head. The volumetric gas flow rate out of the open-ended pipes is L in cm3/sec. The methane concentration within the gas leak is nL in ppmv.
The direct method measures the leak rate in cm3/sec from a gas well pipe [4]. To make this measurement, one first plugs the other well orifices and secures a digital manometer to the one remaining open end of the well head. The flow out of the open end of the well head is usually constricted through a small orifice. The size of the orifice depends on the size of the leak rate. If the manometer does not read a pressure differential, then smaller orifices are chosen until it does. The volumetric flow rate L in cm3/ sec is then determined from the pressure differential and the areal size of the orifice. Next the methane concentration of the leak nL in ppmv is measured directly with a portable methane detector. The methane atomic flow rate is then determined as
 (1)
(1)
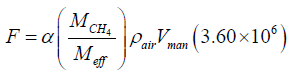
In equation (1), α is the number of methane molecules per second flowing out of the orifice and N is the number of air molecules/cm3, taken to be N = 2.46×1019 cm-3. The conversion of the atomic flux α to a mass flux is
 (2)
(2)
In the equation 2 above, F is the mass flow rate in mg/hr and  is the ratio of the methane molar mass to the effective molar mass of air, taken to be Meff = 28.97. Because nL is actually the mole ratio of methane within the volume of the digital manometer, converts the mole ratio to a mass ratio [5]. ρair is the density of air, taken to be ρair = 1.225 × 10⁻³ g/cm3 and man V is the volume of the gas within the manometer in cm3. 3.60×10⁶ converts g/sec to mg/hr.
Perhaps the largest advantage of this method is that it can be very rapid. Many wells in a field survey can be measured in a relatively short period of time. There are also disadvantages. If the well head integrity is poor, then plugging the other orifices would make the well head leak in other places, perhaps below ground, and the resulting measurement would be inaccurate. Additionally, many extra tools may be needed to adapt the manometer to various types of well heads and pipe sizes. Finally, some leak rates may be too small to measure with the manometer.
Enclosure method
The second technique is a static chamber methodology [6,7]. A schematic diagram illustrating the technique used in this study is shown in Figure 2. In this method, an enclosure is built around the well head. We have used both Mylar plastic with plastic (garbage can) rings at the bottom and the top to form the enclosure. Later, we used cylindrical galvanized steel ventilation ductwork for the enclosure. Both enclosures worked well.

Figure 2: A schematic diagram of a natural gas well head enclosed within a static chamber. The volumetric gas flow rate out of the open-ended pipes is L in cm3/ sec. The methane concentration within the chamber ne (t) is in ppmv and usually increases with time. The background methane concentration outside the chamber is nb in ppmv.
A flow rate diagram illustrating the atomic fluxes into and out of the enclosure is shown in Figure 3. The figure illustrates how the methane concentration can be described by a simple rate equation. The equation describing the concentration of methane in the enclosure is

Figure 3: A schematic diagram illustrating the methane atomic flow rate into and out of the enclosure in CH4 molecules/sec. Methane flows into the enclosure at a rate of α = LNnL from the well head. ne (t) the concentration in ppmv within the enclosure at time t. LNne (t) is the Methane atomic flow rate out of the enclosure through the pressure equalization port.
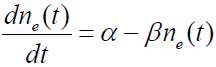 (3)
(3)
In equation (3), ne (t) is the methane concentration within the enclosure in ppmv at a time t after the enclosure is sealed and dne (t)/ dt is its time derivative. α is the rate at which methane molecules enter the well from the well head. α = LNnL , where L is the volumetric leak rate from the well head in cm3/sec, N = 2.46×1019 cm-3 is the number of air molecules/cm3 and nL is the concentration of methane in the leak from the well head in ppmv. βne (t) is the rate at which methane leaves the enclosure through the pressure equalization port, where β = LN. Since the enclosure around the well is sealed at time t=0 , the initial concentration of methane within the enclosure is nb, the local background atmospheric methane concentration. Gas enters the enclosure through the well head at a rate of L cm3/sec and leaves the enclosure through the pressure equalization port at the same rate. Methane enters the enclosure through the well head at a concentration of nL ppmv and leaves the enclosure through the pressure equalization port at a concentration of ne (t) ppmv. After a long time, the methane concentration within the enclosure is expected to reach the value of the leak rate concentration nL.
Under these conditions, the solution to equation (4) is
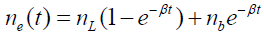 (4)
(4)
This solution predicts that the methane concentration within the enclosure will initially rise at a constant rate given by
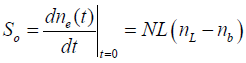 (5)
(5)
In practice, what is measured is the left-hand side of equation (5). Samples of air from within the enclosure are taken at regular intervals. In our measurements, these intervals have ranged from five to forty-five minutes, depending on the initial estimate of the leak rate from the well head. The samples are analyzed for the methane concentration. The determined methane concentration from each sample is plotted versus the time that the sample was taken. The slope of the initial straight-line portion of the plotted data, So = dne(t) /dt, in ppmv/sec is determined from the plot.
It is useful to express the initial rate of change of the measured enclosure methane concentration, So, as a methane mass flux rate from the well head. This conversion is given as
 (6)
(6)
In the above, F is the mass flow rate in mg/hr. So is the initial concentration increase in ppmv/sec. is the ratio of the methane molar mass to the effective molar mass of air, taken to be . The factor 28.97 Meff = converts ppmv, a volume ratio, to a mass ratio. [5] ρair is the density of air, taken to be ρair = 1.225 × 10⁻³ g/cm3. Vencl is the volume of the gas within the enclosure in cm3. (The solid parts of the well head should be subtracted off when they constitute a significant fraction of the enclosure volume.) 3.60×10⁶ converts g/sec to mg/hr.
Note that in equation (4), the exponentials are driven by the volumetric leak rate through β = LN. However, in contrast to the direct method of measuring the volumetric leak rate L, the mass flow rate in the static chamber method is determined without measuring L.
In the field, constructing the enclosures around a well head can be time consuming. Additionally, taking air samples from the enclosure at periodic times is also time consuming. Finally, from equation (5), the background concentration should be measured for small leak rates from a separate enclosure, separated by a small distance from the well head, to determine if the background concentration is changing due to methane exchange at the air/ soil interface or from vegetation within the enclosure.
It should also be noted that the volume of each air sample taken from the enclosure should be only a very small fraction of the total enclosure volume. For small leak rates L , taking air samples from the enclosure can reverse the air flow through the pressure equalization port, diluting the concentration within the enclosure with air containing only the background methane concentration. If the air samples are a significant enough fraction of the enclosure volume, then equation (4) is inaccurate. Conversely, if the leak rate L is insignificant compared to the volumetric flow rate with which the air samples are taken, then the effect of the reversal of the air flow can be accounted for by recalculating ne(t) after every air sample, knowing the volume of each air sample and the volume of the enclosure.
The cylindrical ventilation tubes were approximately 150 cm high and 40 cm in diameter. These cylinders could be stacked and sealed with an exterior flange and gasket for tall well head pipes. The bottom cylinder had one port with a valve for the air sampler and an additional port for pressure equalization. Before placement around a well head, material that would interfere with the cylinder bottom was removed with minimum possible disturbance of the soil. The cylinder was pushed into the ground by an amount of ¼ to ½ inch. The open end of the top cylinder was covered with thick Mylar plastic and sealed with an exterior flange/gasket at the start of the measurements. An additional plastic bucket with air sample and pressure equalization holes was placed into the ground a short distance away from the well head. Periodic samples of the enclosure air were made, usually in regular 5-minute intervals, but the intervals varied from well to well, depending on our estimate of the well leak rate. Background samples from the bucket were made at the beginning and at the end of the measurements from the well head enclosure.
Data Analysis and Results
Field data using the static chamber methodology was collected from four (4) abandoned natural gas wells in Indiana and Westmoreland counties in Pennsylvania. The air samples from the enclosures were analyzed for methane concentration using optical absorption. A more common and direct method for determining methane concentration in the air samples would be to use a GCMS (gas chromatograph mass spectrometer) specific to methane.
Sample optical absorption spectra in the methane absorption wavelength region from one enclosure and a background spectrum taken nearby are shown in Figure 4. These data were acquired in nearly 100% humidity conditions, during a heavy rain. Consequently, the spectral data are heavily convoluted with the numerous water absorptions that are present in this spectral region. The methane absorption lines from the enclosure sample are noted on the red spectral curve of Figure 4.

Figure 4: Optical absorption spectra for an air sample taken from a static chamber built around an abandoned gas well (top, red spectrum). The black spectrum (shifted down by 20%) is the absorption measured for the background sample taken near the enclosure. The methane absorption lines are noted in the red spectrum. The strongest absorptions present in both spectra are water absorptions.
To remove the obscuring effects of the water absorptions, the background spectrum (black curve) in Figure 4 was subtracted from the enclosure spectrum. The result is shown in Figure 5. Almost all of the obscuring effects from the water (and other obscurants) are moved and the methane absorptions are clearly visible. The depth of the methane absorptions indicates a methane concentration of 12.8 ppmv. It should be noted that such subtraction techniques are not necessary with a GCMS determination of the methane concentration. On the other hand, the result of this background subtraction is to change the right-hand-side of equation (5) from NL(nL − nb) to NLnL in the analysis.

Figure 5: Optical absorption characteristic of methane resulting from the subtraction of the background spectrum (black curve) of Figure 4 from the enclosure spectrum (red curve) of Figure 4. The depth of the methane absorptions indicate a methane concentration of 12.8 ppmv.
Based on equation (5), we expect a plot of the methane concentration versus time to be linear with a slope equal to  . The data for seven measurements of the enclosure methane concentration (minus background) versus time are shown in Figure 6. The data is linear and the calculated slope is 0.00655 ppmv/sec. From equation (6), this slope converts to a methane mass flux of 16.8 mg CH4/hr.

Figure 6: Methane concentration within a static chamber enclosing an abandoned well at various times after it is sealed. The methane concentration is observed to increase at a rate of 0.00655 ppmv/sec corresponding to a methane mass flow rate of 16.8 mg/h.
Table 1 shows the results of additional measurements on four natural gas wells in Indiana and Westmoreland counties in Pennsylvania. The mass flux rates for these four wells are seen to vary by over a factor of 10. The well in Westmoreland County was measured twice, in November of 2014 and May of 2015. The first measurement of this well used a plastic and Mylar enclosure; the second measurement use galvanized steel ventilation ducts. We do not believe that the difference in the measurement results is due to the type of enclosure. The difference may be due to seasonal variations in methane emissions from that well.
| Well ID | CH4 Mass Flux (mg/hr) |
|---|---|
| Westmoreland County Well #1 (Nov 2014) | 15.5 |
| Westmoreland County Well #1 (May 2015) | 16.8 |
| Residential Well #1 | 1.1 |
| Residential Well #2 | 1.6 |
| Indiana Well #1 | 6.6 |
Table 1: Methane mass flux rates in mg/hr for four abandoned wells in Indiana and Westmoreland Counties in Pennsylvania. (The Westmoreland County well was measured twice).
Discussion and Summary
Both the direct and enclosure methods for measuring methane leaks rates are useful for determination of leak rates from the population of AOG wells in Pennsylvania. However, it would be worthwhile to compare the two different methods to verify agreement of the results. Secondly, one technique may have advantages over the other under certain circumstances. In situations where the two methods give the same number for the CH4 mass flux rate, the direct measurement of the volumetric flow rate method should be considered a superior field method because it is much faster. When the integrity of the well is questionable, the static enclosure method should be considered superior because plugging multiple orifices may not be a viable approach. Secondly, abandoned wells with questionable integrity may exhibit significantly higher leak rates.
Four wells were measured and the variation in the observed mass flux rates from Table 1 was over a factor of 10. Note that Kang et al. [1,2] found a variation in methane mass fluxes of nearly 106 from 42 measured wells. Additionally, it would be worthwhile to collect all possible information on the characteristics of the highest mass flux wells and continue measuring wells in every region with significant AOG concentrations throughout Pennsylvania. In this manner, reasonable confidence in the average methane mass flux from these wells will lead to a more accurate estimation of the contribution of AOWs to anthropogenic methane emissions in Pennsylvania.
Acknowledgement
The authors gratefully acknowledge financial support through a grant from the Dominion Higher Educational Partnership.
Conflict of Interest Statement
The authors declare that they have no financial or nonfinancial conflict of interest with the subject matter or materials discussed in this manuscript.
References
- Mary Kang (2014) CO2, Methane, and Brine Leakage through Subsurface Pathways: Exploring Modeling, Measurement, and Policy Options.
- Brandt AR, Heath GA, Kort EA, O'Sullivan F, Pétron G, et al. (2014) Energy and Environment: Methane leaks from North American natural gas systems. Science 343: 733-735.
- Kang M, Kanno C, Reid MC, Zhang X, Mauzerall DL, et al. (2014) Direct measurements of methane emissions from abandoned oil and gas wells in Pennsylvania. Proceedings of the National Academy of Sciences.
- https://www.dep.pa.gov/Citizens/Pages/DEP-Newsletter.aspx
- https://kiwi.atmos.colostate.edu/group/dave/pdf/ppmv.pdf
- Livingston G, Hutchinson G (1995) Enclosure-Based Measurement of Trace gas Exchange: Applications and Sources of Error. Methods in Ecology. In, eds. Matson P, Harriss R (Blackwell Science Ltd., Oxford) pp: 14-51.
- Reid MC, Tripathee R, Schafer KVR, Jaffe PR (2013) Tidal marsh methane dynamics: Difference in seasonal lags in emissions driven by storage in vegetated versus unvegetated sediments. J Geophys Res Biogeosci 118: 1802-1813.

Open Access Journals
- Aquaculture & Veterinary Science
- Chemistry & Chemical Sciences
- Clinical Sciences
- Engineering
- General Science
- Genetics & Molecular Biology
- Health Care & Nursing
- Immunology & Microbiology
- Materials Science
- Mathematics & Physics
- Medical Sciences
- Neurology & Psychiatry
- Oncology & Cancer Science
- Pharmaceutical Sciences